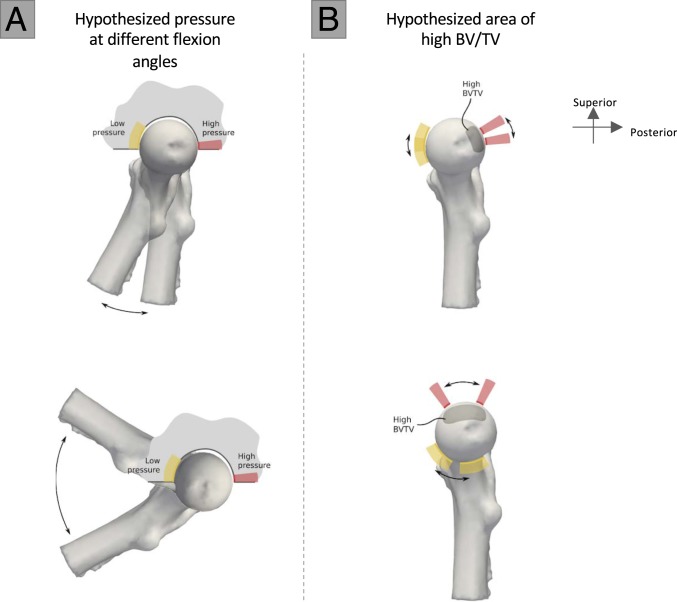
Fig. 1.
A schematic of hypothesized femoral head pressure and trabecular bone distribution at various flexion angles. (A) Hypothesized areas of high (pink) and low (yellow) pressure on the femoral head, based on how the femoral head fits within the incongruent hip joint at low flexion (e.g., bipedalism: Above) and moderate to high flexion (e.g., during terrestrial quadrupedalism and vertical climbing; Below). (B) The predicted resulting areas of high bone volume fraction (BV/TV). For a more detailed explanation refer to SI Appendix, Fig. S4.

