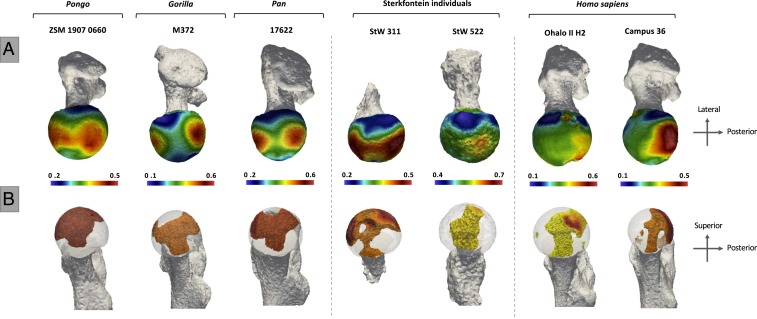
Fig. 4.
BV/TV distribution in the subchondral layer of the femoral head (A) and within the femoral head (B) in the extant and fossil taxa. StW 311 resembles the nonhuman ape-like patterns, while StW 522 resembles the human pattern (in addition to the Paleolithic specimen, Ohalo II, an example from our 19th century German cemetery sample [Campus 36] is used to represent the modern human pattern). Internal concentrations are visualized for BV/TV above the 80th percentile. This threshold was chosen to visualize the regions where the highest BV/TV is found within each specimen. Specimens are scaled to their own data range.

