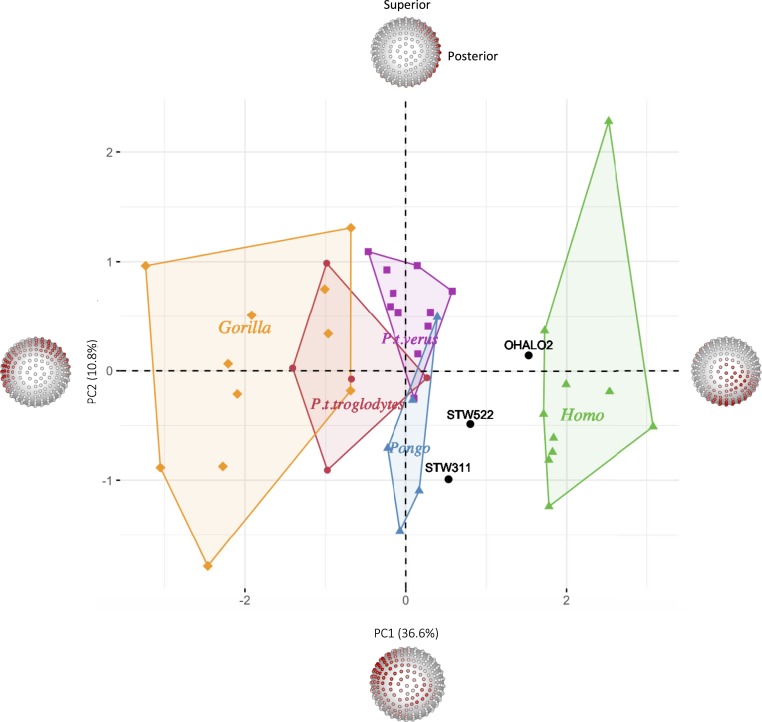
Fig. 5.
PCA of the relative BV/TV distribution in the femoral head. PC1 (x axis) explains 36.6% of the variation, while PC2 (y axis) explains 10.8% of the variation. Landmarked spheres depict RBV/TV regions of highest loading (red) on each PC axis. RBV/TV values on the inferior aspect of the head have the highest positive loading on PC1, (separating H. sapiens from the nonhuman apes) and RBV/TV values on two regions across the superior aspect of the head have the highest negative loading (being most clearly expressed in Gorilla). PC2 does not separate taxa but is driven by high RBV/TV posteriorly versus anterosuperiorly. Considerable variation, specifically in Gorilla, could relate to sexual dimorphism and differences in habitual hip angles between the sexes.

