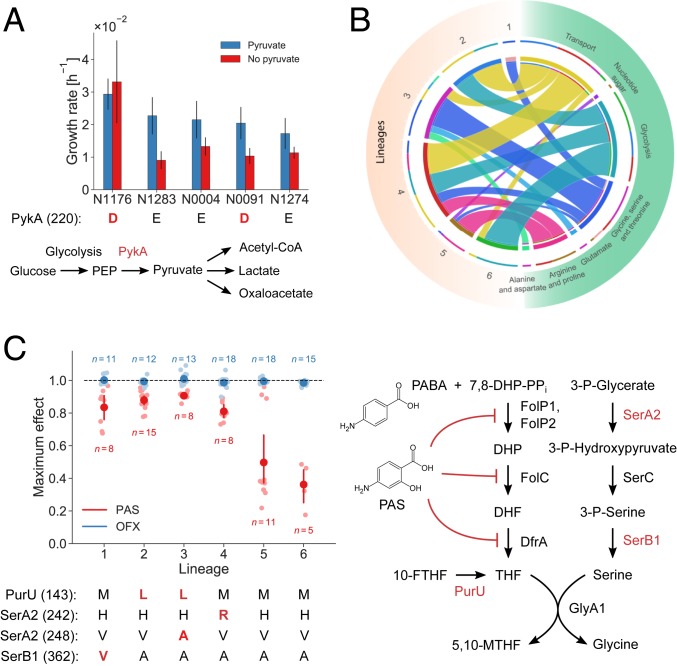
Fig. 4.
Phenotypic consequences of predicted functional SNPs in the MTBC. (A) Estimated growth rates of five strains grown in glucose medium with (blue) and without (red) supplemented pyruvate. Strains affected by the PykA E220D substitution are indicated in red. One experiment was performed for each strain and condition, and error bars indicate two SEs of the growth rate estimate. The pathway diagram shows PykA in its metabolic context. (B) Metabolic subsystems of predicted synthetic lethal interactions involving enzymes affected by functional SNPs. Each ribbon connects an MTBC lineage to a metabolic subsystem, and its size indicates the number of functional SNPs in the lineage that epistatically interact with an enzyme in the metabolic pathway. (C) Sensitivity of strains to the antibiotics PAS and OFX. The plot shows the maximum observed drug effect by lineage with dark dots indicating means and error bars indicating 95% confidence intervals from bootstrapping (1,000 samples). Lineages 1 to 4 were significantly less sensitive to PAS than lineages 5 and 6 (t test, P = 4.5 × 10⁻¹³, n = 55) while all strains were similarly sensitive to OFX. The pathway diagram illustrates the mode of action of PAS, which is an analog of para-aminobenzoic acid (PABA), and its connection to enzymes affected by four predicted functional SNPs in folate metabolism that span lineages 1 to 4 (indicated in red below the plot).

