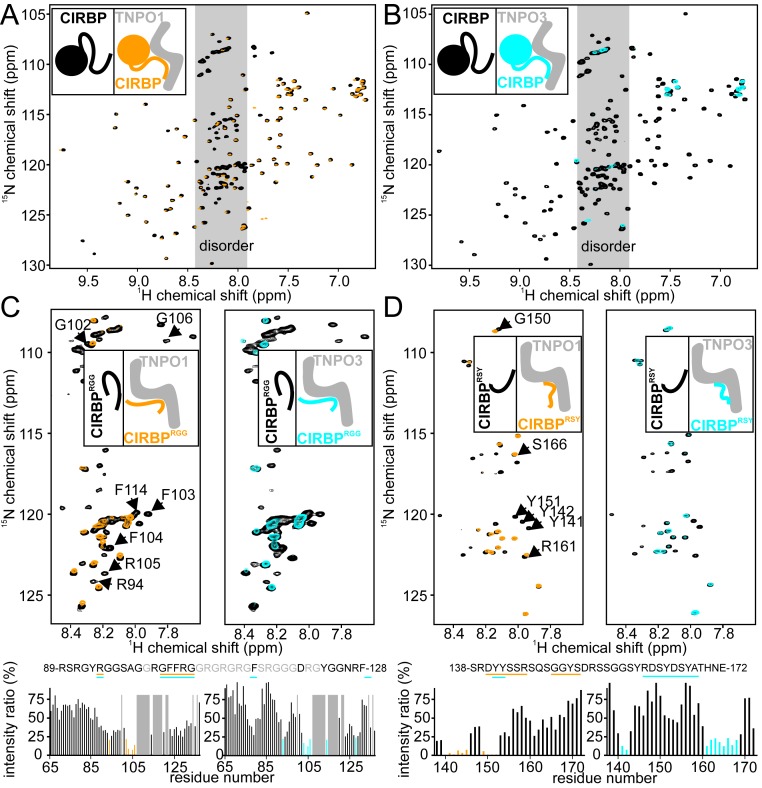
Fig. 3.
Distinct CIRBP regions are directly recognized by TNPO1 and TNPO3. (A and B) 1H-15N HSQC spectrum of full-length 15N-labeled CIRBP at 50 µM without (black) or with addition of one equivalent of TNPO1 (orange in A) or TNPO3 (cyan in B). (C) 1H-15N HSQC spectrum of 15N-labeled CIRBPRGG at 50 µM without (black) or with addition of one equivalent of TNPO1 (orange; Left) or TNPO3 (cyan; Right). The intensity ratio of the 1H-15N HSQC CIRBPRGG cross-peaks between the TNPO1 or TNPO3 free and bound forms are shown in a bar plot, with the CIRBPRGG amino acids strongly affected (ratio < 25%) by TNPO1 or TNPO3 binding colored in orange and cyan, respectively, and highlighted in the CIRBP primary amino acid sequence. The unassigned residues are indicated in gray. (D) Similar to C but using the CIRBPRSY construct in place of the CIRBPRGG construct. A representative cartoon is associated with each NMR spectrum with the unlabeled, NMR-invisible, protein colored gray and the labeled, NMR-visible, partner colored black (unbound), orange (TNPO1-bound), or cyan (TNPO3-bound), respectively.

