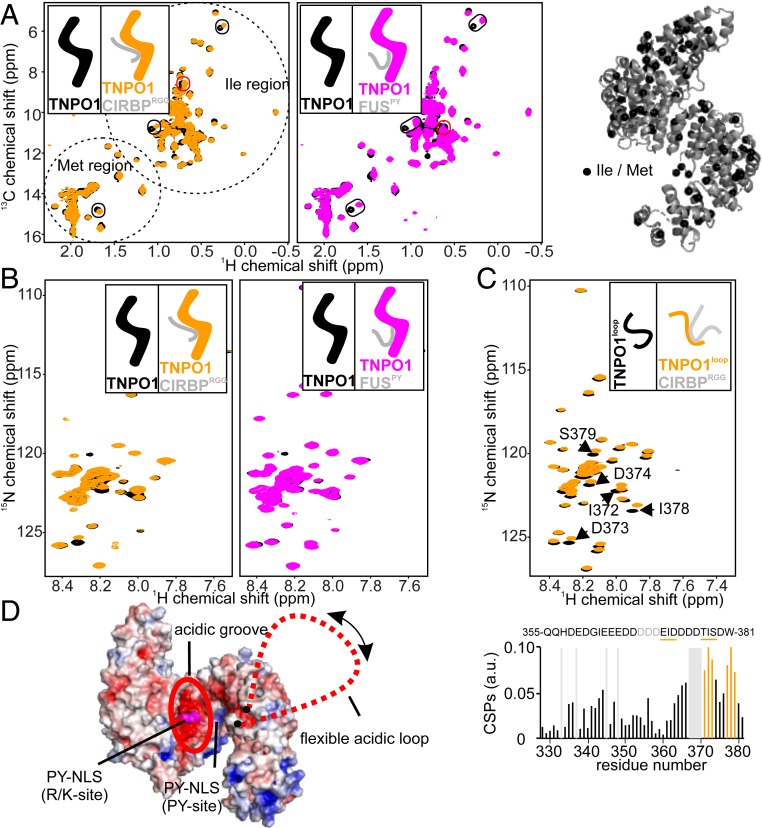
Fig. 4.
CIRBP-RG/RGG region and the PY-NLS of FUS use overlapping binding sites on TNPO1. (A) 1H-13C TROSY-HSQC spectrum of perdeuterated 2H-15N-13C-methyl-IM–labeled TNPO1 at 100 µM without (black) or with addition of one equivalent of CIRBPRGG (orange; Left) or FUSPY (magenta; Right). The peaks specifically affected by CIRBPRGG or FUSPY binding are surrounded in red, and the peaks affected by both CIRBPRGG and FUSPY are surrounded in black. The location of Ile and Met amino acids can be visualized on the 3D X-ray structure of TNPO1 (Protein Data Bank [PDB] ID code 2QMR) (45) with black spheres. (B) 1H-15N TROSY-HSQC spectrum of perdeuterated 2H-15N-13C–labeled TNPO1 at 50 µM without (black) or with addition of one equivalent of CIRBPRGG (orange; Left) or FUSPY (magenta; Right). (C) 1H-15N HSQC spectrum of 15N-labeled TNPO1loop at 50 µM with (orange) or without (black) addition of one equivalent of CIRBPRGG. The chemical shift perturbation (CSP) of the 1H-15N HSQC TNPO1 loop cross-peaks between the CIRBPRGG free and bound forms is shown in a bar plot, with the TNPO1loop amino acids strongly affected (CSP > 0.07) by CIRBPRGG binding colored in orange and highlighted in bold in the TNPO1loop primary amino acid sequence. A representative cartoon is associated with each NMR spectrum with the unlabeled, NMR-invisible, protein colored gray and the labeled, NMR-visible, partner colored black (unbound), orange (CIRBPRGG-bound), or magenta (FUSPY-bound), respectively. (D) Electrostatic surface potential representation of TNPO1 based on its 3D structure solved in complex with FUSPY (PDB ID code 4FQ3) using pymol 2.3.1.

