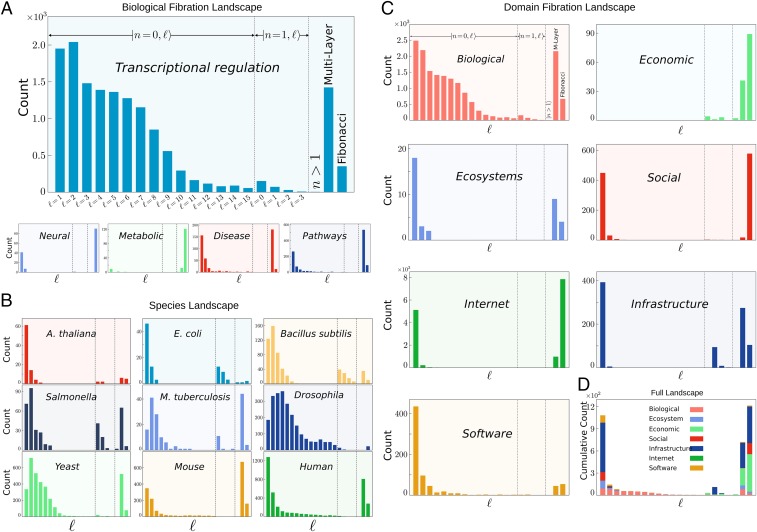
Fig. 4.
Fibration landscape across domains and species. (A) Fibration landscape for biological networks. Shown is the total number of fiber building blocks across five types of biological networks analyzed in the present work. The count includes the total number of fibers in the networks of each biological type considering all species analyzed for each type (SI Appendix, Table IV). (B) Fibration landscape across species. Shown is the count of fibers across each analyzed species. Each panel shows the count over the different types of biological networks (E. coli contains only the transcriptional network; see SI Appendix, Table IV). (C) Fibration landscape across domains. Shown is the count of fibers across the major domains studied. The biological domain panel is calculated over all networks and species in A and B. (D) Global fibration landscape. Shown is the cumulative count of fibers in all domains in C. The cumulative count represents the total number of fibers per network of nodes. Specifically, the quantity is calculated as the total number of fibers divided by the total number of nodes in all networks per domain multiplied by .

