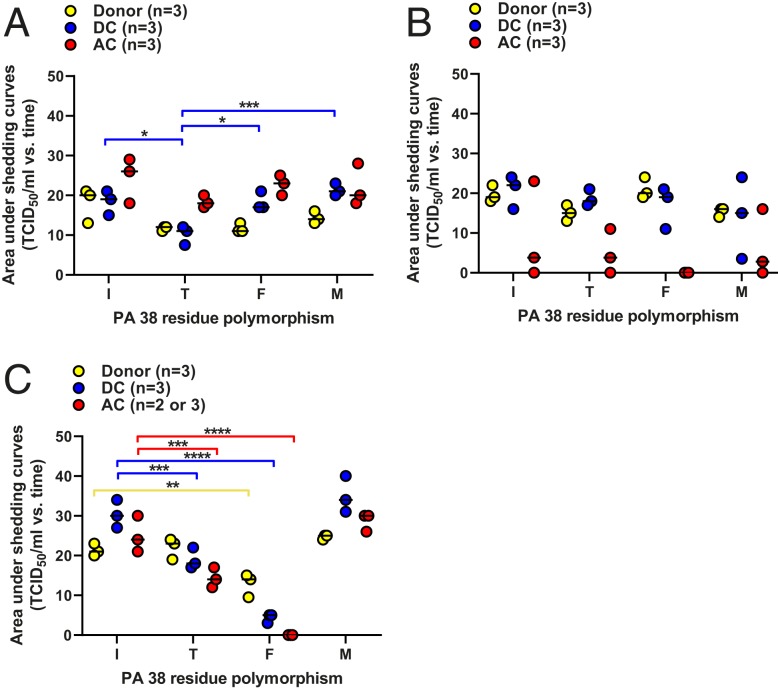
Fig. 4.
AUC for virus shedding in ferrets by I38-WT and 38T/F/M influenza A and B viruses. Ferrets were inoculated and housed as described in the legend for Fig. 3. The AUCs for virus shedding from ferrets inoculated with (A) A/CA/04 (H1N1)pdm09, (B), A/TX/71(H3N2), or (C) B/BR/60 (Victoria lineage) viruses for individual donors (gold), DCs (blue), and ACs (red) were calculated in GraphPad Prism 8.0. Data are presented as individual animal shedding curve values ± the SEM. P values and associated bars are color coded to indicate the contact groups(s) being compared. *P < 0.05; **P < 0.01, ***P < 0.001; ****P < 0.0001. Lack of comparison bars and P values on each graph represents “not significant.”

