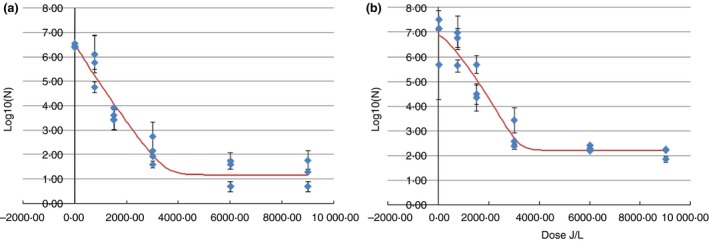
Figure 1.

Inactivation kinetics of the strains Escherichia coli K88 (a) and E. coli K99 (b) after UV‐C irradiation. Escherichia coli K88 presented a Log linear plus tail inactivation kinetics while E. coli K99 showed a Weibull plus tail inactivation kinetics. ‘Measured’ indicate the real data obtained during the experiment. ‘Identified’ is the best model fit for prediction kinetics obtained by the GInaFiT program  Measured ;
  Identified [Colour figure can be viewed at http://wileyonlinelibrary.com]
