
Figure 1.
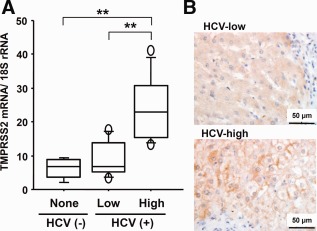
TMPRSS2 expression in human liver tissues. (A) Quantification of TMPRSS2 mRNA in livers of the HCV‐negative (None), HCV‐low (Low), and HCV‐high (High) groups. mRNA levels were quantified by qPCR using a standard curve from serial dilution of standard cDNA. The quantity of TMPRSS2 was normalized against that of 18S rRNA and is expressed in arbitrary units. HCV (−), nontumorous livers from 5 patients with hepatic metastases of colon cancer; HCV (+), nontumorous livers from 8 and 9 patients containing low and high viral loads, respectively, as shown in http://onlinelibrary.wiley.com/doi/10.1002/hep.27426/suppinfo. Two asterisks indicate a significant difference (P < 0.01) by Mann‐Whitney's U test. (B) IHC for TMPRSS2 protein in nontumorous liver with the low and high HCV loads. Brown, immunostain for TMPRSS2 with DAB; blue, counterstain for nuclei with hematoxylin; bar, 50 µm.