
Figure 1.
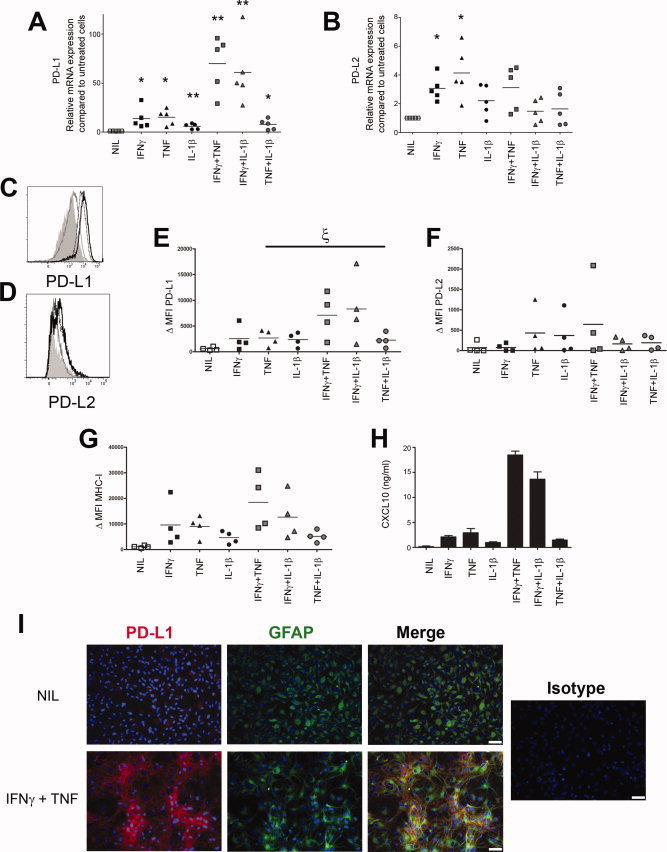
Human astrocytes up‐regulate PD‐L1 expression following proinflammatory cytokine treatments. Human astrocytes (n = 4 or 5 donors) were either untreated (NIL) or stimulated with cytokines and PD‐L1 and PD‐L2 expression was determined by qPCR, FACS, or immunocytochemistry. PD‐L1 (A) and PD‐L2 (B) mRNA expression by astrocytes. (C and D) Representative FACS profiles gated on GFAP+ cells illustrating PD‐L1 (C) and PD‐L2 (D) protein expression. Filled gray histogram: isotype control; gray line: untreated cells; dotted line: IFN‐γ; solid black line: IFN‐γ + TNF. Quantified FACS detection (ΔMFI) of PD‐L1 (E), PD‐L2 (F), and MHC‐I (G) on astrocytes. (H) CXCL10 production by astrocytes quantified by ELISA. (I) Representative micrographs of either untreated (NIL) or IFN‐γ + TNF activated astrocytes stained for PD‐L1 (red), GFAP (green), and nuclei (blue) with the corresponding isotype. Scale bar = 50 μm. Paired Student's t‐test comparing nil versus indicated cytokine treatment *P < 0.05; **P < 0.01; ξ: 0.05 > P < 0.1.