
Figure 5.
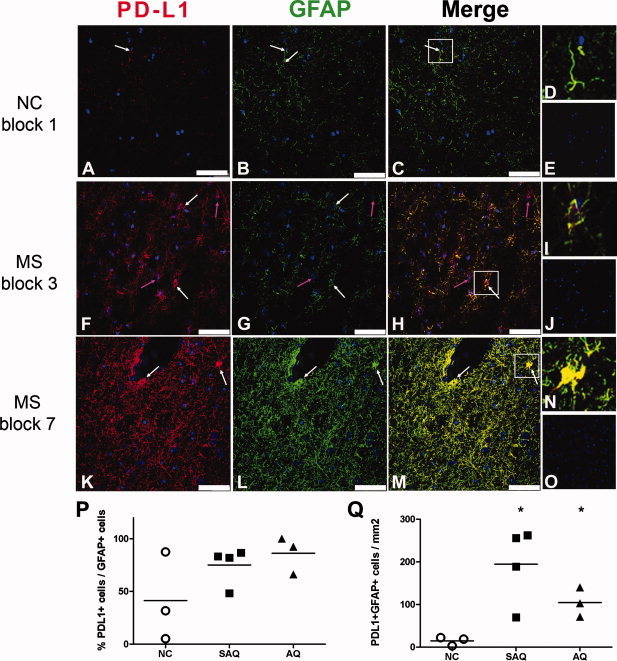
PD‐L1 expression by astrocytes is strongly enhanced in MS brain lesions compared with normal controls. (A–O) Micrographs showing brain sections stained for PD‐L1 (red), GFAP (green), and nuclei (blue) of one representative normal control (A–D), and two representative MSdonors (F–J and K–N). Corresponding isotypes are shown in E, J, and O. Scale bar = 50 μm. White arrows indicate examples of GFAP+ PD‐L1+ cells and pink arrows indicate examples of GFAP‐ PD‐L1+. (C‐H‐M) Cells in white boxes shown enlarged in D‐I‐N. (P–Q) Quantification of astrocytes expressing PD‐L1 in human brain sections (at least five fields analyzed per section) from normal controls (NC), subacute (SAQ), and acute MS lesions (AQ). Each dot represents one distinct section. (P) Percentage of astrocytes positive for PD‐L1 in brain sections; (Q) number of astrocytes positive for PD‐L1 per mm2 for all donors. Student's t‐test comparing normal controls versus MS lesions *P < 0.05.