
Figure 1.
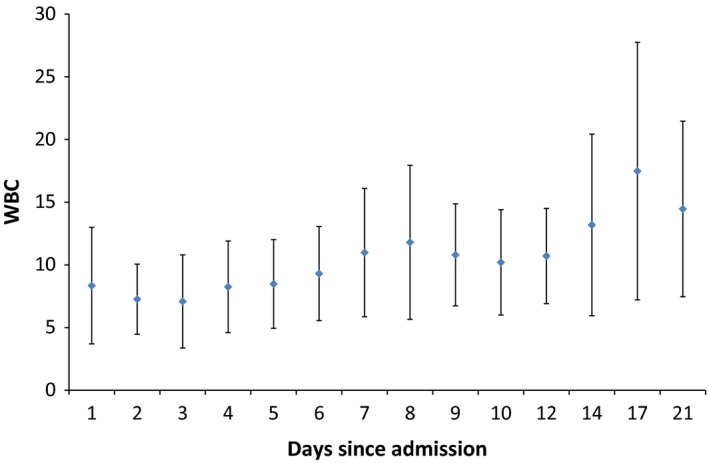
An error bar indicating the mean ± standard deviation of daily white blood cell count (×109/L). [Colour figure can be viewed at http://wileyonlinelibrary.com].
Official websites use .gov
A
.gov website belongs to an official
government organization in the United States.
Secure .gov websites use HTTPS
A lock (
) or https:// means you've safely
connected to the .gov website. Share sensitive
information only on official, secure websites.
An error bar indicating the mean ± standard deviation of daily white blood cell count (×109/L). [Colour figure can be viewed at http://wileyonlinelibrary.com].