
Figure 2.
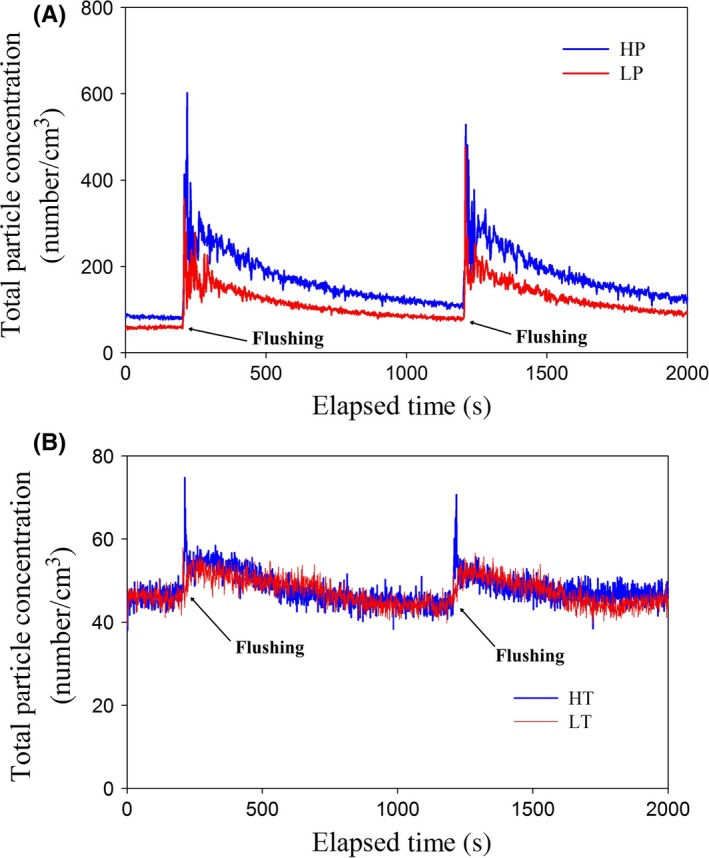
Temporal profile of total particle (0.3‐10 μm) emission strength upon toilet flushing in the (A) high‐pressure (HP, in blue) and low‐pressure (LP, in red) and (B) high‐tank (HT, in blue) and low‐tank (LT, in red) conditions
Official websites use .gov
A
.gov website belongs to an official
government organization in the United States.
Secure .gov websites use HTTPS
A lock (
) or https:// means you've safely
connected to the .gov website. Share sensitive
information only on official, secure websites.
Temporal profile of total particle (0.3‐10 μm) emission strength upon toilet flushing in the (A) high‐pressure (HP, in blue) and low‐pressure (LP, in red) and (B) high‐tank (HT, in blue) and low‐tank (LT, in red) conditions