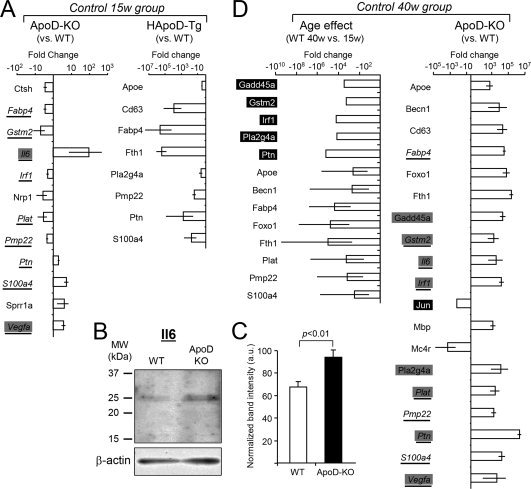
Figure 7.

Quantitative RT‐PCR expression profiles of intact nerves of different genotypes and age groups. A: Profile of genes that change their expression in intact 15 weeks nerves of ApoD‐KO and HApoD‐Tg mice. WT intact nerve expression is used as the calibrator for each gene (n = 6/group). B, C: Immunoblot analysis of Il6 in total protein preparations of 33 weeks old intact WT and ApoD‐KO nerves. Protein levels were quantified by band densitometry normalized to β‐actin signal. Il6 expression shows a 1.4 fold increase in ApoD‐KO nerves with respect to WT. D: Gene profiles in 40‐week‐old intact nerves. Left graph shows the age effect in the profile of WT gene expression (WT 40‐week and 15‐week nerves are compared). Right graph shows the gene profile of 40‐week intact nerves from ApoD‐KO mice using the 40‐week WT intact nerve as calibrator. Gray and black boxes point to genes turned on and off respectively. Underlined genes are ApoD‐dependent in both age groups. n = 8/group. Only statistically supported changes (Mann‐Whitney's U‐test) with Log 2−ΔΔCt ≥ ±0.3 (twofold increase) are shown.
