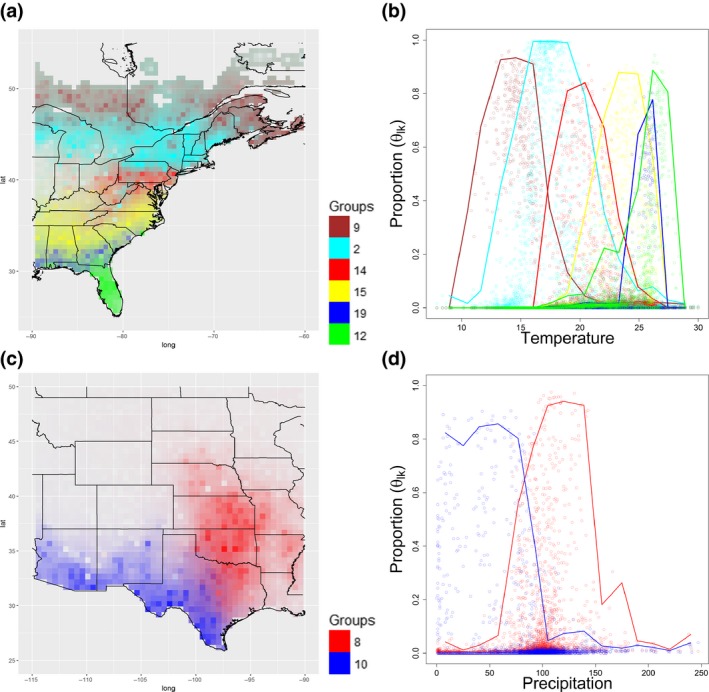
Figure 5.

Biogeographical patterns of a subset of the species groups identified by LDA. The proportion of individual groups (given by the posterior mean ) is depicted in these panels. (a) displays the latitudinal bands formed by groups 2, 9, 12, 14, 15, and 19 along the East coast. (c) displays the spatial pattern of groups 8 and 10. In both (a) and (c), higher proportion of individual groups is depicted using more opaque (i.e., less transparent) colors and different groups are depicted with different colors. (b, d) reveals that average June temperature and precipitation gradients seem to strongly constrain the spatial distribution of these breeding bird groups, respectively. Circles represent the estimated proportion for each location and group while lines depict suitability envelopes. These envelopes were created by first defining equally spaced intervals on the x‐axis and then calculating the median x value and the 99% percentile of y within each interval and connecting these results. Notice that the same color scheme is used for right and left panels
