
Figure 2.
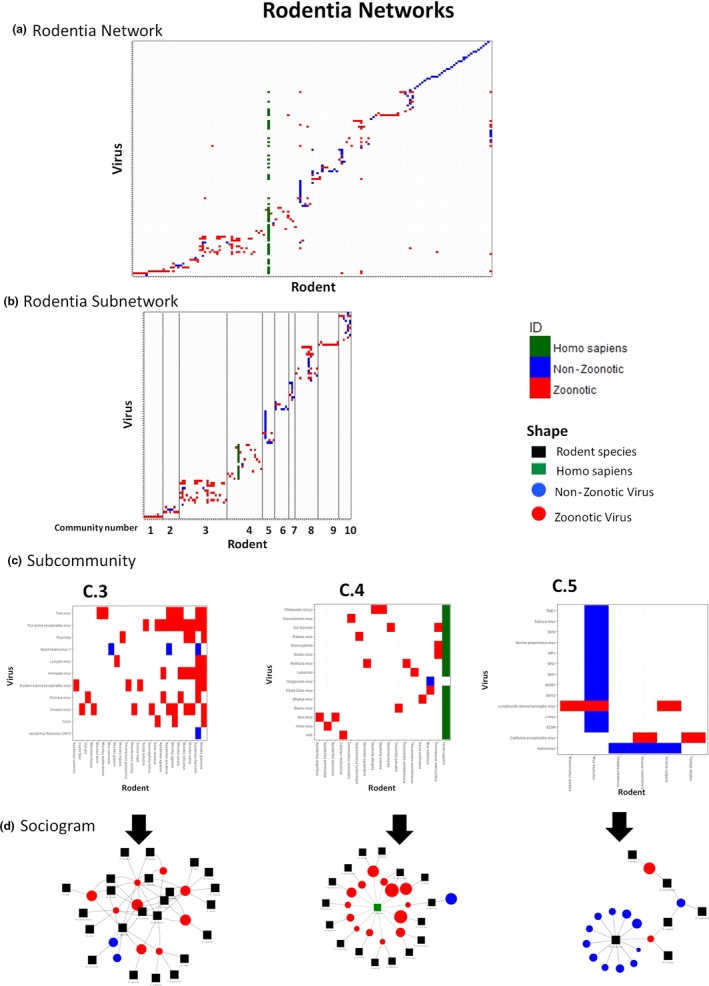
Rodentia networks. (a) Whole Rodentia network. (b) Subnetwork, with 10 selected communities, renamed with a consecutive number. Lines were added to separate the communities. (c) Subcommunities selected to show the host–species interactions; (d) Sociogram to facilitate the visualization of the interactions [Colour figure can be viewed at http://www.wileyonlinelibrary.com]