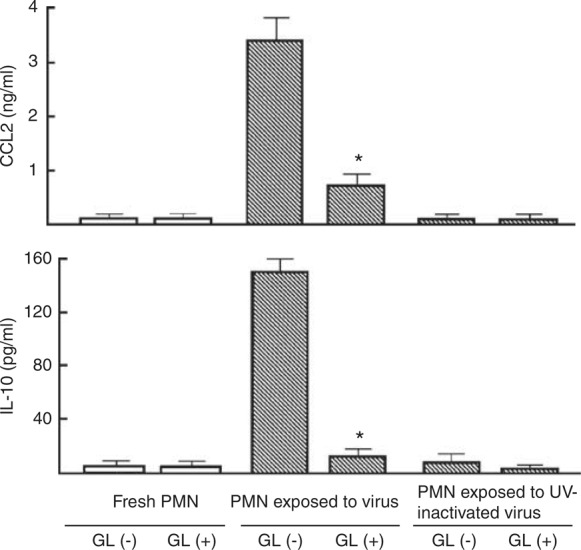
Figure 3.

Effect of GL on CCL2 and IL‐10 production by PMNs exposed to R5 HIV. PMNs (2 × 10⁶ cells ml−1) were exposed to 1580 TCID50 per ml of R5 HIV or ultraviolet (UV)‐inactivated R5 HIV for 3 h. PMNs not exposed to the virus were cultured as a control. The cells were washed with media and re‐cultured with or without 100 μg ml−1 of GL for 18 h. Culture fluids harvested were assayed for CCL2 and IL‐10. The data are displayed as the mean±s.e.m., and are representative of three experiments. * P<0.05 compared with control.
