
Figure 1.
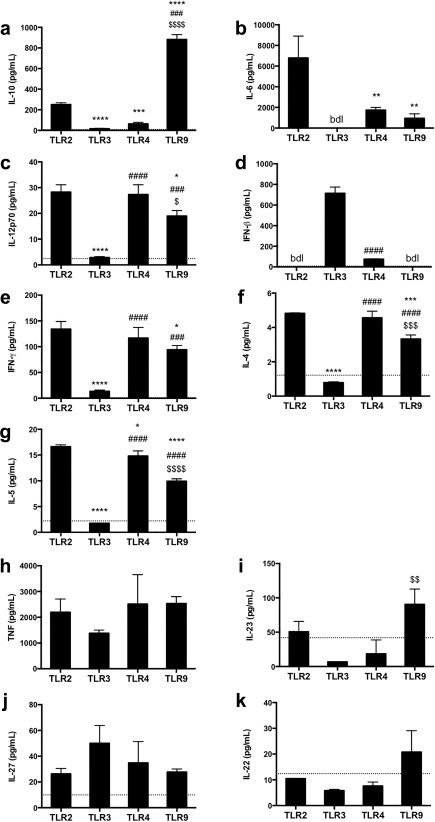
Inflammatory landscape of TLR‐stimulated microglia. (a–k). Primary microglial cell cultures were left unstimulated or stimulated for 24 hr with chemical TLR agonists for TLR2, TLR3, TLR4, or TLR9, as described in Section 2. Cell culture supernatants were collected and cytokine production was measured by multiplex assay (IL‐10, TNF, IL‐12p70, IL‐23, IL‐27, IL‐22, IFN‐γ, IL‐4, and IL‐5) or ELISA (IL‐6 and IFN‐β). Unstimulated cells did not produce detectable amounts of cytokines. The detection limit for each cytokine is represented as a dotted line in each graph. Represented are the mean ± SD for triplicate wells per condition set after mixed cultures generated from independent mice. Statistical differences were assessed by one‐way ANOVA or student's t test. Significant statistical differences relative to TLR2 are represented by *; to TLR3 by #; to TLR4 by $. One symbol, p < .05; two, p < .01; three, p < .001; and four, p < .0001. bdl, below detection level