
Figure 3.
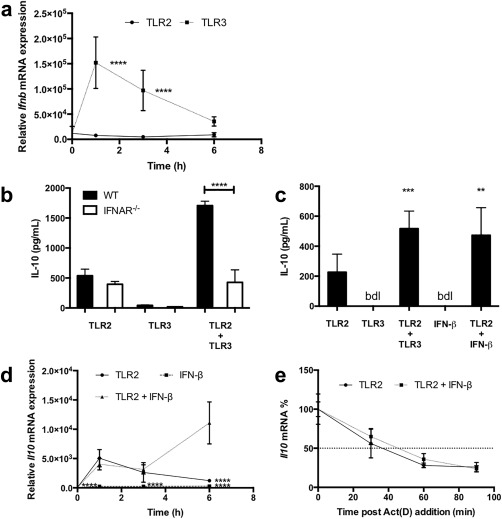
IFN‐β directly enhances IL‐10 transcription in TLR‐activated microglia. (a) WT microglial cells were stimulated for 6 hr with TLR2 (open circle) or TLR3 (close square) agonists. RNA samples were collected at the indicated time‐points poststimulation and rt‐PCR was performed to evaluate Ifnb gene expression. (b) Microglial cells generated from WT and IFNAR−/− mice were stimulated with TLR2 and TLR3 agonists alone or in combination. Cell culture supernatants were collected 24 hr poststimulation and IL‐10 production was measured by multiplex. (c) WT microglial cells were stimulated with TLR2 and TLR3 agonists in the presence or absence of recombinant IFN‐β. Cell culture supernatants were collected and IL‐10 production was measured by ELISA. (d) WT microglial cells were stimulated for 6 hr with the TLR2 agonist (open circle), recombinant IFN‐β (close square) or with their combination (close circle). RNA samples were collected at the indicated time‐points poststimulation and rt‐PCR was performed to evaluate Il10 gene expression. (e) WT microglial cells were stimulated for 1 hr with the TLR2 agonist alone (open circle) or in combination with recombinant IFN‐β (close circle) and then actinomycin D was added to cells. The Il10 mRNA stability was measured as before. The dotted line represents 50% of the RNA detected at 1 hr after stimulation. Represented are the mean ± SD for triplicate wells per condition for two independent experiments. Statistical differences were assessed by one‐ or two‐way ANOVA. Significant statistical differences are represented by ** to p < .01; *** to p < .001; and **** to p < 0.0001. ActD, actinomycin D; bdl, below detection level