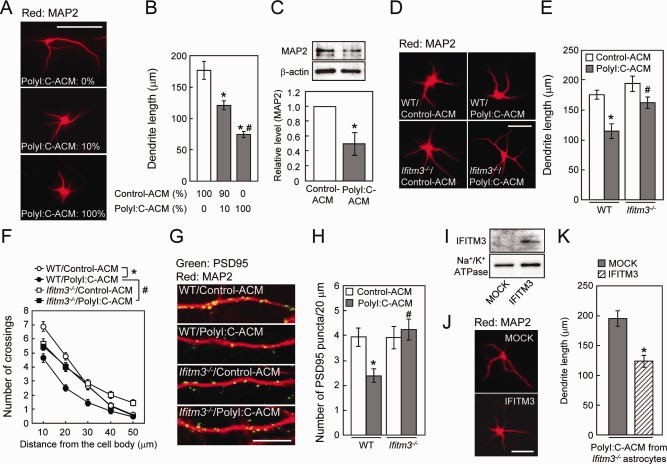
Figure 4.

Role of IFITM3 in the polyI:C‐ACM‐induced defect of dendrite and spine formation in vitro. (A) Representative images of MAP2‐positive dendrites of primary cultured neurons incubated with the indicated doses of polyI:C‐ACM. Scale bar: 100 µm. (B) MAP2‐positive dendrite length. Values are the means ± SEM (n = 27–31). *P < 0.05 versus control‐ACM, # P < 0.05 versus 10% polyI:C‐ACM. (C) MAP2 protein levels in primary cultured neurons incubated with polyI:C‐ACM at a dose of 100%. Values are the means ± SEM of three independent experiments. *P < 0.05 versus control‐ACM. (D) Representative images of MAP2‐positive dendrites of primary cultured neurons incubated with control‐ or polyI:C‐ACM from wt or ifitm3−/− astrocytes. Scale bar: 100 µm. (E, F) MAP2‐positive dendrite length (E) and Sholl analysis of dendrite (F). Values are the means ± SEM of three independent experiments (n = 44–49). Dendrite length: polyI:C‐ACM (F (1,178) = 18.73, P < 0.0001), genotype (F (1,178) = 9.60, P < 0.01), interaction (F (1,178) = 1.81, P = 0.18). Dendrite complexity: polyI:C‐ACM (F (1,178) = 24.18, P < 0.001), genotype (F (1,178) = 5.29, P < 0.05), interaction (F (1,178) = 6.56, P < 0.05). *P < 0.05 versus wt/control‐ACM, # P < 0.05 versus wt/polyI:C‐ACM. (G) Representative images of PSD95 puncta (green) and MAP2 (red) of the hippocampal neurons on DIV7. Scale bar: 10 µm. (H) Number of spines on neurons (PSD95 puncta per 20 µm along dendrites). Values are the means ± SEM of three independent experiments (n = 17–20). Number of PSD95 puncta: polyI:C‐ACM (F (1,72) = 2.48, P = 0.12), genotype (F (1,72) = 5.35, P < 0.05), interaction (F (1,72) = 5.65, P < 0.05). *P < 0.05 versus wt/control‐ACM, # P < 0.05 versus wt/polyI:C‐ACM. (I) IFITM3 protein expression in ifitm3−/− astrocytes at 48 h after the transfection. (J) Representative images of MAP2‐positive dendrites of cultured neurons incubated with polyI:C‐ACM from ifitm3−/− astrocytes transfected with either mock or myc‐IFITM3. Scale bar: 100 µm. (K) MAP2‐positive dendrite length. Values are the means ± SEM (n = 22–28) of two independent experiments. *P < 0.05 versus polyI:C‐ACM from ifitm3−/− astrocytes transfected with mock‐control.
