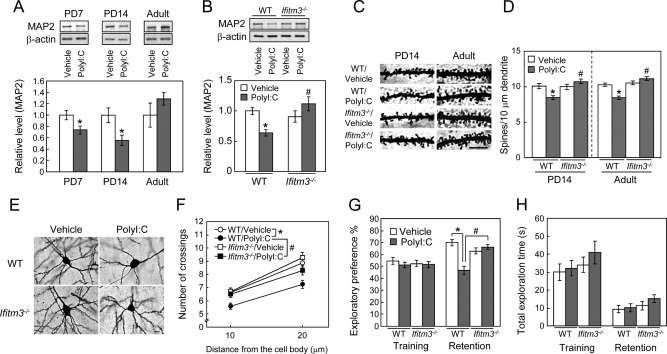
Figure 5.

Role of IFITM3 in the polyI:C‐induced neurodevelopmental impairments in the frontal cortex. (A) Time‐course changes in MAP2 protein levels in the frontal cortex of mice. Values are the means ± SEM (n = 3–5). *P < 0.05 versus vehicle‐treated control mice. (B) MAP2 expression in the frontal cortex of vehicle‐ or polyI:C‐treated wt or ifitm3−/− mice on PD14. Values are the means ± SEM (n = 9–17). MAP2: polyI:C (F (1,44) = 0.73, P = 0.40), genotype (F (1,44) = 4.70, P < 0.05), interaction (F (1,44) = 10.11, P < 0.01). * P < 0.05 versus vehicle‐treated wt mice, # P < 0.05 versus polyI:C‐treated wt mice. (C) Representative images of the spines of cortical pyramidal neurons (Golgi staining). Scale bar: 10 µm. (D) Quantitative analysis of spine density of the cortical pyramidal neurons. PD14; n = 25–30 neurons from three to four mice [polyI:C (F (1,104) = 1.80, P = 0.183), genotype (F (1,104) = 9.960, P < 0.01), interaction (F (1,104) = 12.179, P < 0.001)]. Adult; n = 32–44 from three to four mice [polyI:C (F (1,148) = 5.64, P < 0.0001), genotype (F (1,148) = 34.10, P < 0.05), interaction (F (1,148) = 22.74, P < 0.0001)]. * P < 0.05 versus vehicle‐treated wt mice, # P < 0.05 versus polyI:C‐treated wt mice. (E, F) Sholl analysis of dendrite complexity of cortical pyramidal neurons in adult mice. (E) Representative images of cortical pyramidal neurons. Scale bar: 10 µm. (F) Quantitative analysis of dendrite complexity. Mean intersections of cortical dendrites with a 10 μm concentric circle. n = 30–44 neurons from three to four mice [polyI:C (F (1,130) = 15.08, P < 0.001), genotype (F (1,130) = 5.79, P < 0.05), interaction (F (1,130) = 1.68, P = 0.20)]. * P < 0.05 versus vehicle‐treated wt mice, # P < 0.05 versus polyI:C‐treated wt mice. (G, H) Role of IFITM3 in the polyI:C‐induced cognitive impairment of mice in adulthood. (G) Exploratory preference. (H) Total exploration time. Values are the means ± SEM (n = 8–11). Exploratory preference (%) in the retention session: polyI:C (F (1,34) = 5.12, P < 0.05), genotype (F (1,34) = 13.02, P < 0.01), interaction (F (1,34) = 23.11, P < 0.0001). *P < 0.05 versus vehicle‐treated wt mice, # P < 0.05 versus polyI:C‐treated wt mice.
