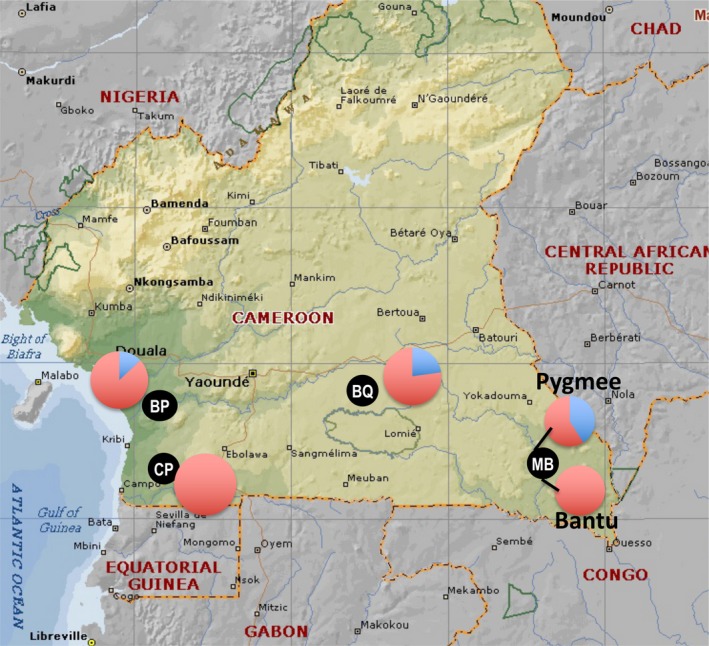
Figure 1.

Map illustrating the proportion of respondents consuming bats (in blue) versus non consuming (red) in the four study sites (black dots) in rural southern Cameroon (Campo [CP], Gwap/Bipindi [BP], northern periphery of Dja [BQ] and Mambele [MB]) [Colour figure can be viewed at http://wileyonlinelibrary.com]
