
Figure 6.
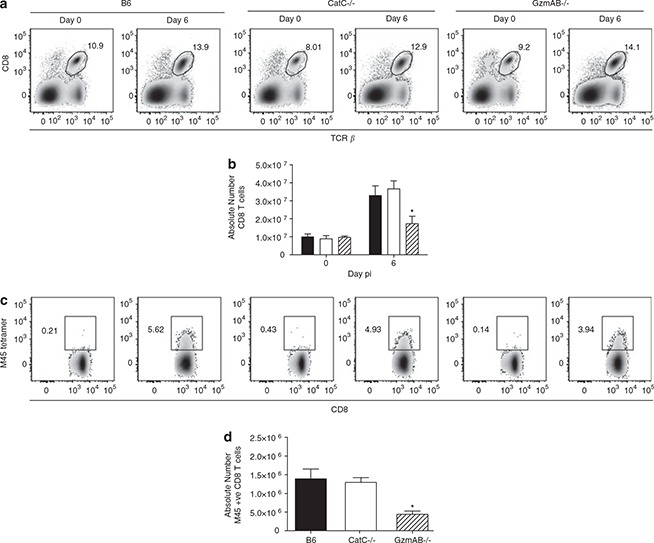
Expansion of antigen‐specific CTL does not require CatC. B6, B6.CatC−/− and B6.GzmAB−/− mice were infected with 5 × 10³ PFU of MCMV‐K181‐Perth. On day 6 p.i, splenocytes were collected and stained with CD8 and TCR‐β antibodies and M45 tetramers. Representative FACS plots showing percentages of CD8+ T cells in the spleens of the various mouse strains are shown (a). Total numbers of CD8+ T cells are shown in (b). Representative FACS plots showing percentage of M45‐specific CD8+ T cells per spleen are shown in (c) and total numbers of M45‐specific CD8+ T cells are shown in (d). B6 mice (solid bar), B6.CatC−/− (open bar) and B6.GzmAB−/− (hatched bar). Data from two independent experiments have been pooled, mean ± s.e.m. are plotted (n⩾4).