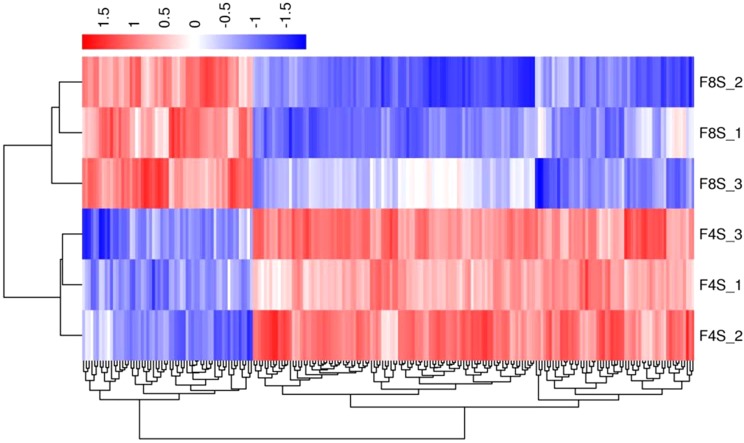
Figure 4. The cluster for DEGs of F8SvsF4S.
Different rows represent different samples and different columns represent different genes. Different colors represent the level of gene expression for the samples; red indicates high level expression of genes, while the blue indicates low level expression of genes.

