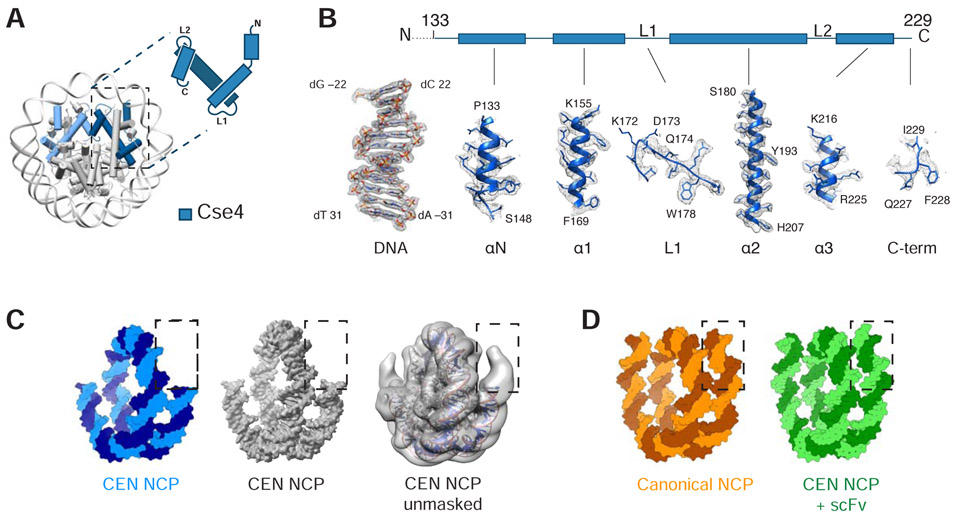
Figure 3.
Structural details of centromeric histone Cse4 and DNA ends. A. Cartoon representation of centromeric (CEN)-NCP and schematic representation of Cse4 histone. B. Density map of centromeric histone Cse4 and a representative DNA region. Dashed line indicates unmodeled N-terminus of Cse4 (residues 1-132). C. Left two, surface representation of 601 DNA from CEN-NCP structure in blue and masked density map of the CEN-NCP at 2.7Å resolution in grey. Right, unmasked density map of the CEN-NCP filtered to low resolution in grey with cartoon representation of the CEN-NCP model (structures from this paper). D. Surface representation of 601 DNA from crystal structure of canonical NCP (PDB ID: 1ID3) and of native apha-satellite DNA from cryo-EM structure of CEN-NCP+scFv (PDB ID: 6E0P) (21, 29).

