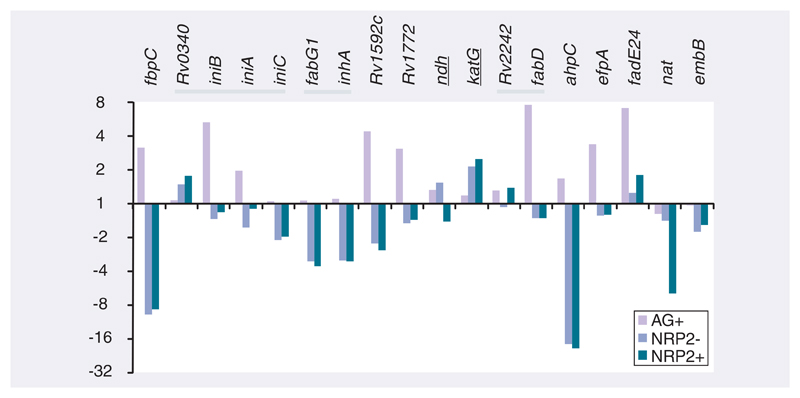
Figure 4. The changes in RNA abundance of genes associated with INH resistance in log-phase and NRP2 bacilli ± INH relative to drug-free log-phase bacilli.
Expression ratios, derived from the microarray dataset, are plotted in fold change for log-phase aerobic (AG) and NRP2 ± INH treatment. Genes are ordered by chromosome position, with the dark bars highlighting adjacent genes. Underlined gene annotations indicate that the repression of these gene products in NRP2 may be hypothesized to increase INH tolerance. Conversely, the over-expression of the remaining genes might be expected to increase INH tolerance in NRP2.
AG: Aerobic; INH: Isoniazid; NRP: Nonreplicating persistence.

