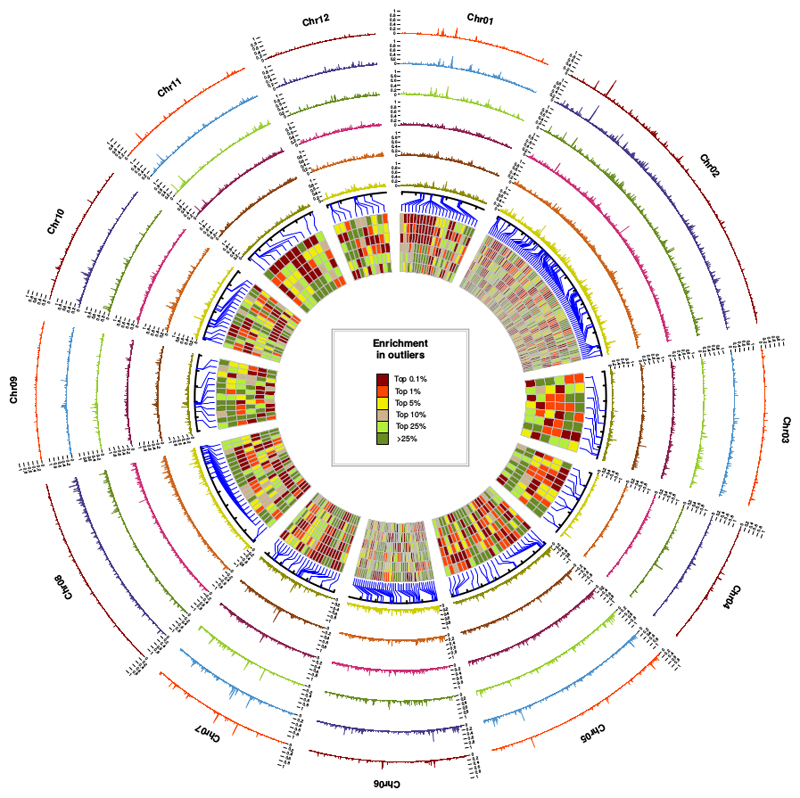
Fig. 4. Local density in outliers per non-overlapping 10 kb sliding window.
From outside to inside, the species pairs are Q. robur/Q. petraea, Q. pyrenaica/Q. petraea, Q. pubescens/Q. petraea, Q. robur/Q. pubescens, Q. robur/Q. pyrenaica and Q. pubescens/Q. pyrenaica. An outlier corresponds to a SNP with a level of differentiation exceeding the expectations assuming the inferred evolutionary history (0.9999 quantile, see Fig.2 for details). Detailed patterns are accessible from: https://github.com/ThibaultLeroyFr/GenomeScansByABC/. Each rectangle in the inner circle represents the level of enrichment in outliers with He ≤ 0.2 for each pair of species at a given position in the genome, assuming the same order of pairs. These rectangles correspond to the 281 most outlier-enriched windows found in at least one of the six pairs (top 0.1%).

