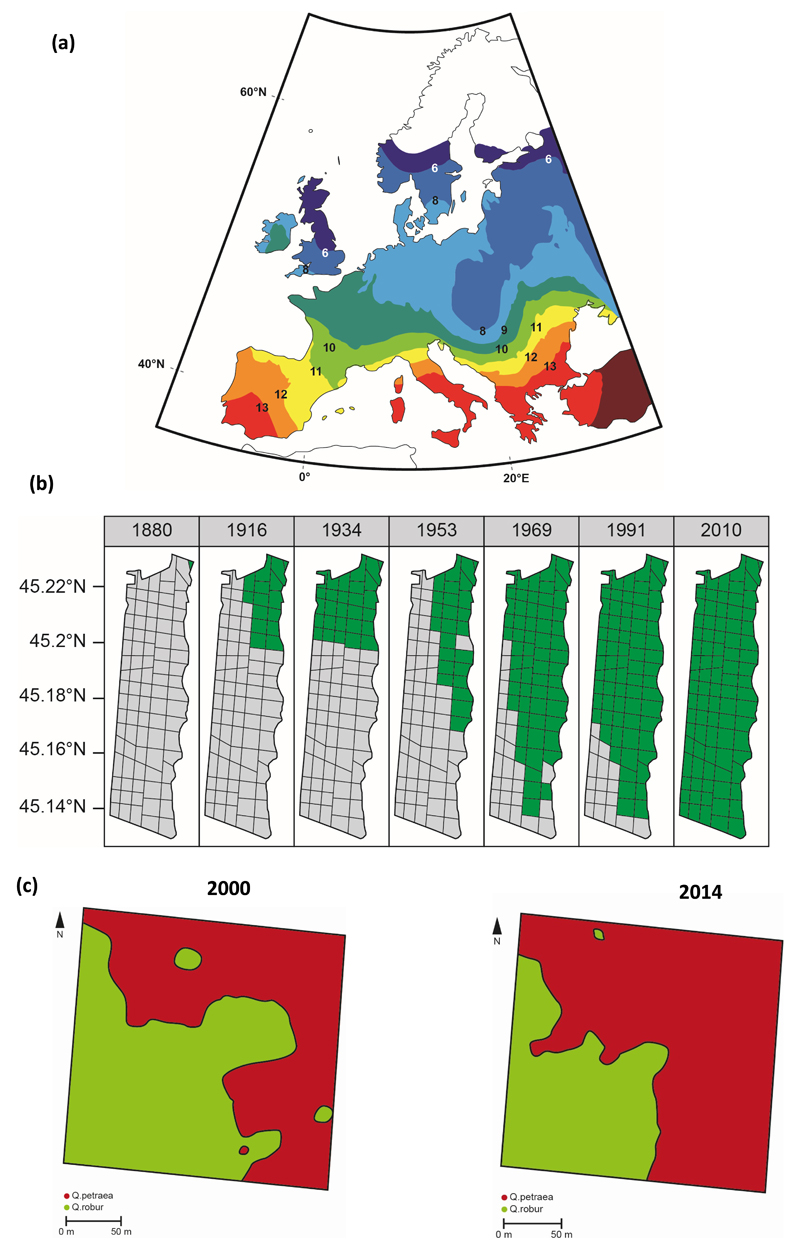
Figure 1. Velocity of oak migration at different time and spatial scales.
-
a)Migration velocity of deciduous oaks retrieved from palynological records retracing postglacial colonization in Europe.This map shows isochrones pollen maps at 1000 year time slices from 13000 BP to 6000 BP, representing arrival times of oaks as derived from the European Pollen Data (EPD) base (Brewer et al., 2002). Velocity varied over time and space, with average values amounting to 500 m./year and maximum values up to 1000 m./year (Brewer et al., 2005). Although palynological records may overestimate migration effects due to the persistence of small refugial populations, these figures were recently confirmed by updating EPD data (Giesecke et al., 2016; Giesecke and Brewer, 2018).
-
b)Migration velocity of Holm oak (Quercus ilex) during the last century at the northern margin of its distribution (Delzon et al., 2013). Holm oak is a Mediterranean evergreen species and its northern margin stretches along the Atlantic coast in France. These maps illustrate its distribution (in green colors) in a national forest located on the Atlantic coast at different times during the last century. Forest maps show compartment subdivisions (black lines). Maps were derived from floristic inventories conducted at the compartment level by the forest service every 10 to 20 years when management plans of national forest are renewed. Migration velocity amounted on average to 20 m./year with maximum values up to 57 m./year. These figures are likely underestimated as Holm oak is locally considered as a weed by foresters and screened during thinning operations.
-
c)Expansion of Quercus petraea over two successive generations in La Petite Charnie Forest, located in the North Western part of France (Truffaut et al., 2017). The map shows the distribution of individual trees of each species (red area: Quercus petraea; green area: Q. robur) in 2000 and 2014, before and after natural regeneration occurred. Q. petraea has expanded its distribution by up 50 %, corresponding to maximum linear shifts of 20 meters.

