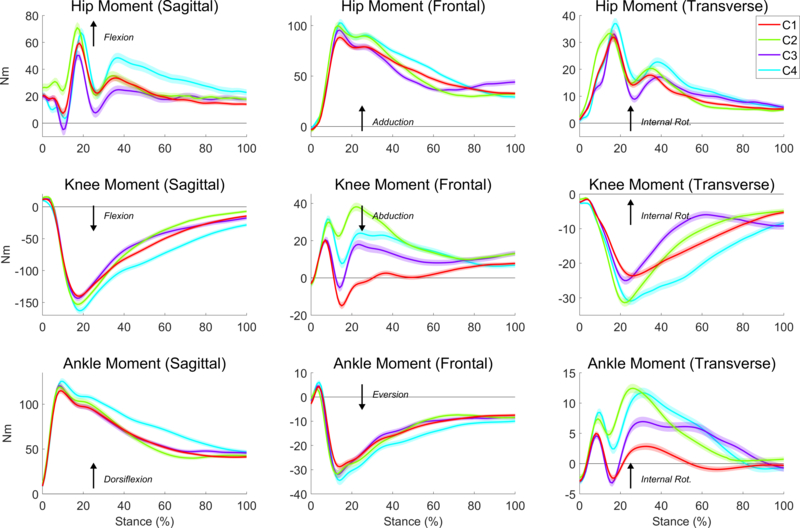
Fig. 4.

Average hip, knee, and ankle joint moment of force time series across all participants in each of the four clusters detected from the clustering analysis of the SLD trial. Each waveform represents the mean external joint moment of force for the specified DOF, and the arrows indicate the interpretation convention for each moment. Shaded regions indicate standard error regions between the groups.
