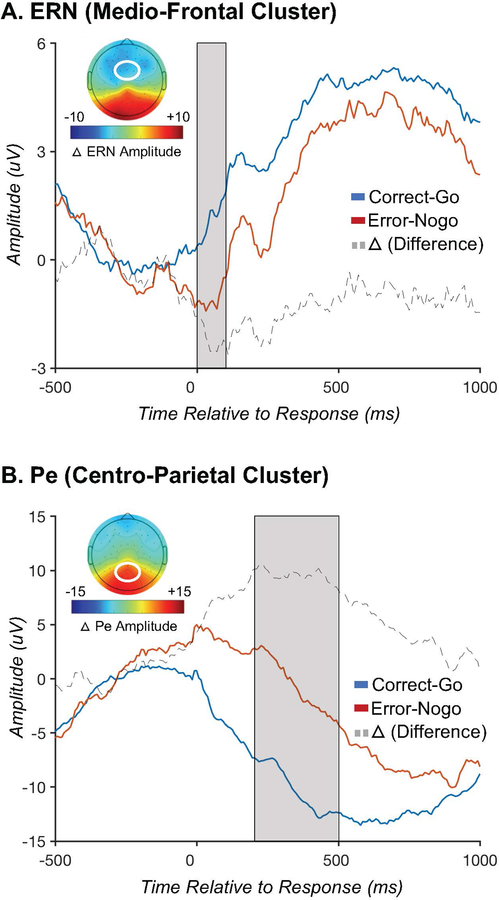
Figure 3.
Error-related negativity (ERN) and Error Positivity (Pe). Figure 3A depicts the response-locked ERN at a cluster of frontocentral electrodes, where the ERN is typically maximal. Note that in the ERP plots the ERN is more negative (larger) on error trials (red) than correct trials (blue); in the topographic plot, the ERN is shown to be most negative over frontal regions, as depicted by in blue shading of the topo plot in this region (corresponding to negative values). Dotted line is for ∆ERN. Figure 3B depicts the response-locked Pe at a cluster of centroparietal electrodes, where the Pe is typically maximal. Note that the Pe is more positive (larger) on error trials.

