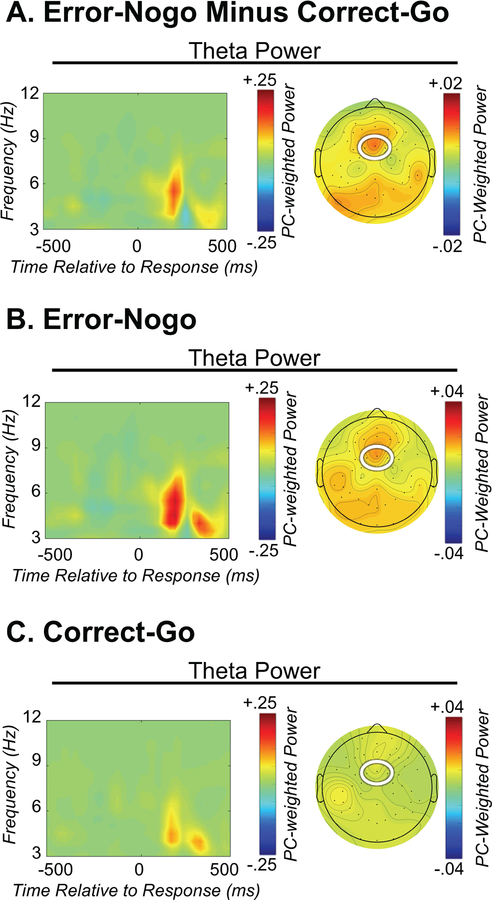
Figure 4.
Error-related time-frequency theta power. Figure 4A depicts response-locked theta power after subtraction of correct from error trials and weighting by a principal component that captures error-related theta power. Figure 4B and 4C depict response-locked theta power during error and correct trials respectively. Note that theta power is increased on error trials. Left plots: time-frequency surface plotted for a cluster of frontocentral electrodes. Right plots: corresponding topographic plot of the principal component capturing theta power.

