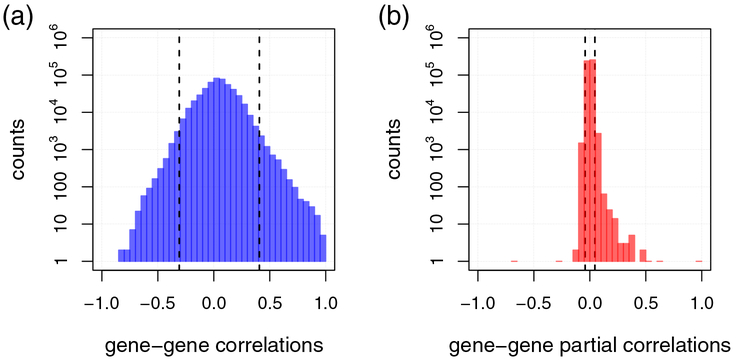
Figure 3: Distribution of gene-gene Pearson correlations and full order partial correlations.
Figure (a) shows the distribution of gene-gene Pearson’s correlation coefficients estimated for single-cell RNA sequencing data of melanoma metastases from Tirosh et al. (2016). Figure (b) shows the corresponding distribution of full order partial correlations estimated using the R package GeneNet (Schaefer et al., 2015). The black dashed lines in (a) mark the highest and lowest percentile (99% and 1%) of (anti-)correlations. In (b), the corresponding lines are shown for partial correlations. Notice that for both (a) and (b) the y-axis is on log-scale.

