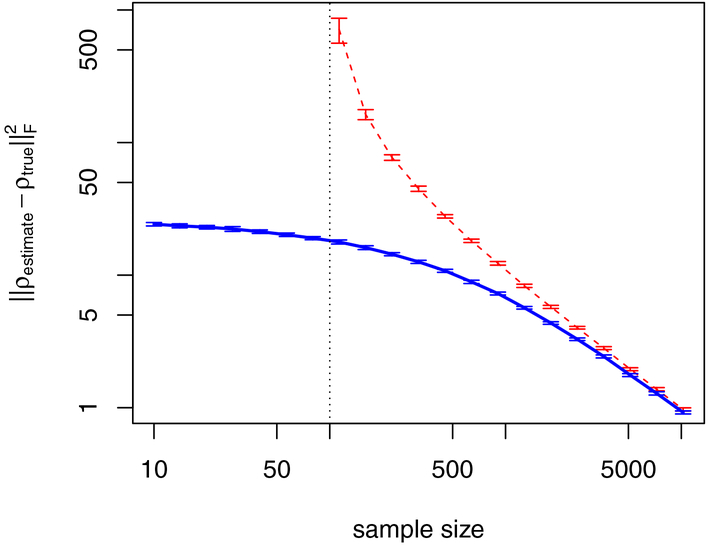
Figure 5: Partial correlation estimation accuracy.
We simulated data for p = 100 variables and 248 true edges (5% of all possible edges) for different sample sizes. The y-axis gives the deviation between partial correlation estimates and the ground truth, calculated as , where ρestimate is the estimate, ρtrue the ground truth, and ||.||F the Frobenius norm. Here, the red curve is the estimate obtained from covariance matrix inversion, which is only possible for sample sizes N > p. N = p is indicated by the vertical black dotted line. The blue line shows the corresponding result using the covariance shrinkage approach of Schaefer et al. (2015). We observe that covariance shrinkage provides estimates for sample sizes N < p and that estimates improve considerably for moderate sample sizes N > p. Note that both axes are on a logarithmic scale.

