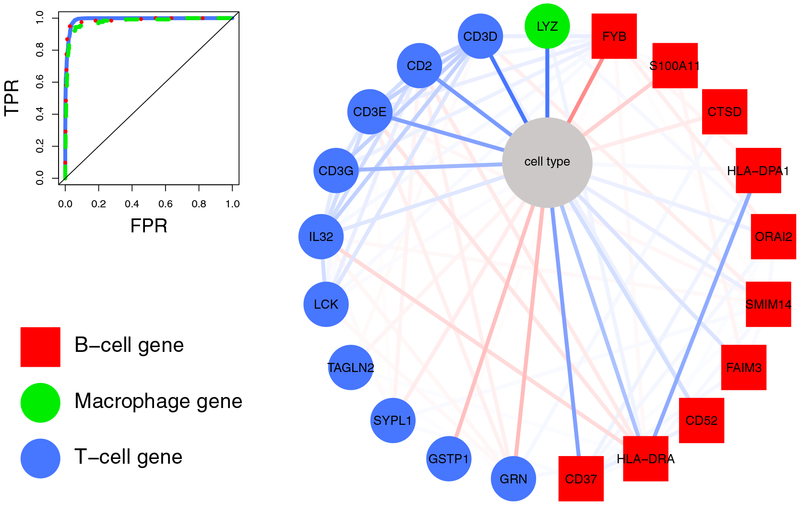
Figure 6: First order neighborhood of the node “cell type”.
The right figure shows the neighborhood of the categorical variable “cell type”. Edge intensity reflects the strength of an association from strong positive (dark blue) to strong negative association (dark red). The node color indicates if the selected gene is specific for B cells (red squares), macrophages (green circles), and T cells (blue circles). T-cell genes are, e.g., CD3D, CD3E, CD3G, which encode proteins of the T-cell receptor-CD3 complex, CD2, that encodes a surface antigen present on all peripheral blood T cells, and Interleukin 32 (IL32), which encodes a cytokine increased in the activation of T cells. B-cell related genes (red) are, e.g., CD37, which encodes a cell-surface protein whose expression is restricted to cells of the immune system, with highest expression in mature B cells, and HLA-DRA, which is one of the HLA class II alpha chain paralogues that is expressed in antigen presenting cells. The only selected macrophage gene was Lysozyme (LYZ). Lysozymes are associated with the monozyte-macrophage system and enhance the activity of immunoagents. The corresponding classification performance in differentiating T and B cells, and macrophages from the remaining cells is shown in the upper left corner.

