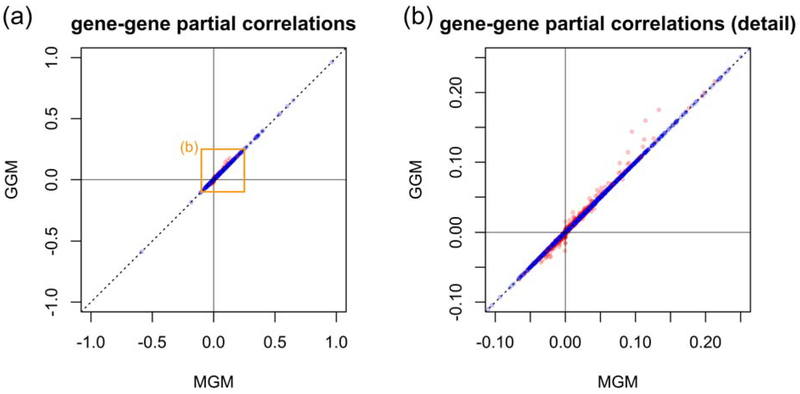
Figure 7: Partial correlation estimates GGM versus MGM.
Figure (a) compares the partial correlations estimated using a GGM (y-axis) with those estimated using a MGM that additionally contains the cell type as a discrete node (x-axis). For better comparability, we estimated both the GGM and MGM as described in Altenbuchinger et al. (2019). Figure (b) shows the orange area indicated in (a). Red circles correspond to genes that are directly connected to the cell-type node in the MGM approach.

