

Abstract
Background & Aims:
Little is known about prevalence and risk factors for nutritional deficiencies in adolescents after metabolic bariatric surgery. We performed a 5-year prospective cohort study of these.
Methods:
Adolescents who had Roux-en-Y gastric bypass (RYGB, n=161) or vertical sleeve gastrectomy (VSG, n=67) were enrolled at 5 tertiary-care centers from March 2007 through February 2012. The final analysis cohort included 226 participants (161 who had RYGB and 65 who had VSG). We measured serum levels of ferritin; red blood cell folate; vitamins A, D, B1, B12; and parathyroid hormone at baseline and annually for 5 years. General linear mixed models were used to examine changes over time and identify factors associated with nutritional deficiencies.
Results:
The participants were 75% female and 72% white, with a mean age of 16.5±1.6 years and mean body mass index of 52.7±9.4 kg/m2 at surgery. Mean body mass index decreased 23% at 5 years, and did not differ significantly between procedures. After RYGB, but not VSG, serum concentrations of vitamin B12 significantly decreased whereas serum levels of transferrin and parathyroid hormone increased. Ferritin levels decreased significantly after both procedures. Hypo-ferritinemia was observed in 2.5% of patients before RYGB and 71% at 5 y after RYGB (P<.0001), and 11 % of patients before VSG and 45% 5 y after VSG (P=.002). No significant changes in serum levels of folate or vitamins A, B1, or D were found between baseline and 5 y after either procedure. By 5 y, 59% of RYGB and 27% of VSG recipients had 2 or more nutritional deficiencies. Risk factors associated with specific deficiencies included surgery type, female sex, black race, supplementation intake, weight regain, and for females, pregnancy.
Conclusions:
In a prospective study of adolescents who underwent RYGB or VSG, we observed nutritional deficiencies by 5 y after the procedures—particularly in iron and B12 after RYGB. Ongoing nutrient monitoring and supplementation are recommended for all patients, but surgery type, supplementation intake, sex, and race might affect risk.
ClinicalTrials.gov number, NCT00474318.
Keywords: BMI, PTH, long-term, outcome
INTRODUCTION
Nutritional deficiencies are a significant concern following metabolic bariatric surgery, and may lead to osteoporosis, chronic anemia and/or permanent neurological deficits if unrecognized or inadequately managed.1, 2 Lifelong micronutrient supplementation is therefore recommended.3 While prevalence of nutritional deficiencies has been estimated largely from adult cohorts4, bariatric surgery is an increasingly accepted treatment for severe obesity in youth.5 Yet, lower adherence to supplementation6 and anticipated longer lifespan with altered gastrointestinal physiology may increase risk of adverse nutritional outcomes in these youth.
Earlier studies investigating nutritional deficiencies after adolescent bariatric surgery were retrospective, single center studies.7, 8 In 2015, the Teen-Longitudinal Assessment of Bariatric Surgery (Teen-LABS) consortium, a multicenter prospective observational study, reported worsening iron and B12 status, but no significant changes in vitamin A, D, B1, folate or albumin levels, in adolescents 3 years after Roux-en-y gastric bypass (RYGB) or vertical sleeve gastrectomy (VSG).9 However, deficiencies may progress over longer duration, as nutrient stores are further depleted. A recent multicenter prospective study following 81 adolescents after RYGB found nutritional deficits in 72% by 5 years. Yet this study lacked VSG recipients, now the predominant procedure performed in adolescents and adults and presumed to carry lower nutritional risk.10 Further, no prior studies have examined specific clinical or demographic factors associated with nutritional deficiencies after surgery. Identifying high-risk youth and risk factors could inform screening, prevention, and earlier intervention.
We therefore aimed to characterize longitudinal changes in iron status, vitamins B12, B1, folate, A, D, albumin, and calcium homeostasis (PTH) in adolescents over 5 years after VSG or RYGB and to determine factors associated with nutritional deficiencies. We hypothesized that deficiencies would increase over time, particularly after RYGB, and that lower supplement intake and female sex would be independent risk factors.
METHODS AND MATERIALS
Population
The observational Teen-LABS cohort study ( NCT00474318) enrolled 242 adolescents, 13-19 years old, undergoing laparoscopic bariatric surgery (March 2007 - February 2012) at five U.S. centers. Methodological details and CONSORT diagram have been previously described.9 The study was approved by each center’s Institutional Review Board. All parents/guardians and adolescents provided written informed consent or assent.
The analysis cohort included 226 participants (RYGB n=161, VSG n=65), excluding 14 who underwent adjustable gastric banding and 2 who underwent VSG with preexisting conditions that could impact nutritional biomarkers (see Supplemental Material).
Measures
Age, sex, race, ethnicity, household demographics, height, weight, BMI, and comorbidities, were collected within 30 days of operation at in-person visits.9
Blood samples and clinical data were obtained at baseline and 6, 12, 24, 36, 48 and 60 months post-surgery. The Northwest Lipid Metabolism and Diabetes Research Laboratories, (Seattle, Washington) measured serum ferritin, transferrin, vitamin B12, erythrocyte transketolase activity coefficient (B1 status), red blood cell folate, vitamin A, 25-hydroxyvitamin D (25-OH-D), parathyroid hormone (PTH), and albumin.9 High sensitivity C-reactive protein (hs-CRP) was measured to account for systemic inflammation.
Abnormal values were defined as: hypoferritinemia, females <10 μg/L and males <20 μg/L; high transferrin, females >382 mg/dL and males >392 mg/dL; low vitamin B12 <145 pg/mL; low B1 status, erythrocyte transketolase activity coefficient ≥1.30; low folate ≤5.8 ng/mL; low vitamin A <301 μg/L; low vitamin D deficiency <20.1 ng/mL; elevated PTH >88 pg/mL; hypoalbuminemia <3.5 g/dL, elevated hs-CRP>1.0 mg/dL.9,11
Multivitamin, iron, calcium, vitamin D and B12 supplements were recommended at each visit, following standard of care guidelines. 4 Participants reported intake of these nutritional supplements at each visit, and frequency taken per week was estimated. We assessed metformin and acid suppression intake (histamine blockers and proton pump inhibitors) as they may influence iron and B12 status.12–14
For females, we recorded pregnancy history and categorized menstrual frequency as amenorrhea (≤3 menses per year), oligomenorrhea (4-9 menses per year) or normal menses (≥10 menses per year).
Statistical Analysis
The distributions of all variables were assessed. Non-normally distributed nutrient biomarkers were log transformed (ferritin, B12, PTH and hs-CRP). Categorical variables are presented using frequencies and percentages, while continuous variables are presented as means and standard deviations or medians and 25th and 75th percentiles (as interquartile range [IQR]). We examined nutrient concentrations over time (visit) for each surgery group, focusing on changes during 3 intervals: 1) baseline to year 1, the period of rapid weight loss; 2) the linear trend between year 1 to 5, the period of relative weight stabilization; and 3) baseline to year 5, the net change. Visit was treated categorically for the baseline to years 1 and 5 comparisons, whereas the trend across visits was fitted for years 1 to 5 comparison using a linear model. Tukey-Kramer adjustment was used when testing categorical differences over time. The same approach was used for determining change in prevalence of abnormal nutritional biomarker levels over time. We used generalized linear mixed models (GLMM) to examine change over time for both continuous and categorical outcome variables. A logit link was used for categorical outcome variables. Subject was used as the repeated variable with random terms of intercept and site.
The GLMM approach also was used to identify predictors of nutritional status 1 to 5 years post-operatively. Prespecified variables included visit, surgery type, sex, race, caregiver educational level and baseline nutritional level as fixed effects, and study center as a random effect. Weight change between visits and self-reported multivitamin use were included as time-varying covariates. Additional variables (see Supplemental Material) were included for specific models.
We also analyzed potential effects of pregnancy and irregular menses on nutritional status in females. Pregnancy at each visit was defined as being either currently pregnant or within 6-months post-partum.
A p<0.05 was considered statistically significant. Sensitivity analyses and analyses to account for missing data are described in Supplemental Material.15 All authors had access to the study data and reviewed and approved the final manuscript.
RESULTS
Participant characteristics
The cohort (Table 1) was predominantly female (75%), white (72%) and non-Hispanic (93%). At baseline, mean age (±SD) was 16.5 (±1.6) years and mean BMI was 52.7 (±9.4) kg/m2. The mean BMI declined similarly in RYGB and VSG over 5 years (Table 2), with no appreciable changes in height.
Table 1: Participant characteristics of the analysis cohort by surgery type.
Data presented as mean (standard deviation) or n (%).
| Variable | Gastric Bypass (n=161)* | Sleeve Gastrectomy (n=65) |
|---|---|---|
| Age at surgery (years) | 16.6 (1.6) | 16.4 (1.6) |
| Sex (Female) | 126 (78.3) | 44 (67.7) |
| Race: | ||
| White | 119 (73.9%) | 44 (67.7%) |
| Black | 35 (21.7%) | 14 (22.5%) |
| Asian | 1 (0.6%) | 0 |
| American Indian or Alaskan Native | 0 | 1 (1.5%) |
| More than one race | 6 (3.7%) | 6 (9%) |
| Hispanic | 15 (9.3%) | 1 (1.5%) |
| Household income: | ||
| <$25,000 | 51 (32.7%) | 30 (50.0%) |
| $25,000-$49,999 | 31 (19.9%) | 13 (21.7%) |
| $50,000-$74,999 | 28 (18.0%) | 10 (16.7%) |
| ≥$75,000 | 46 (29.5%) | 7 (11.7%) |
| Missing | 5 | 5 |
| Caregiver level of education: | ||
| <high school | 11 (7%) | 12 (19%) |
| High school graduate | 47 (30%) | 21 (34%) |
| Some college | 67 (42%) | 20 (32%) |
| College graduate | 32 (20%) | 9 (14%) |
| Missing | 4 | 3 |
| Insurance: | ||
| Caregiver has insurance | 136/156 (87%) | 53/62 (86%) |
| Patient covered by this insurance | 93/136 (68%) | 39/53 (74%) |
| Weight (kg) | 150.9 (30.3) | 144.4 (32.8) |
| Height (cm) | 167.5 (8.5) | 169.0 (10.2) |
| BMI (kg/m2) | 53.7 (9.6) | 50.2 (8.3) |
| Baseline diagnoses | ||
| Diabetes | 25/161 (16%) | 7/161 (11%) |
| Dyslipidemia | 126/160 (79%) | 44/63 (70%) |
| Elevated blood pressure | 73/159 (46%) | 23/63 (36%) |
| Abnormal kidney function | 28/153 (18%) | 7/59 (12%) |
| NAFLD | 70/161 (44%) | 18/64 (28%) |
| GERD | 19/161 (12%) | 10/64 (16%) |
| PCOS (females only) | 27/125 (22%) | 6/44 (14%) |
The denominator is provided [n=] when the data were not available on all subjects
Table 2:
Trends in nutritional biomarkers over five years after gastric bypass or sleeve gastrectomy surgery in adolescents.
| Baseline | 6 months | Year 1 | Year 2 | Year 3 | Year 4 | Year 5 | P-value for comparison of values between visits† | |||
|---|---|---|---|---|---|---|---|---|---|---|
| Nutritional biomarker | Median* | Median* | Median* | Median* | Media* | Median* | Median* | Baseline to 1y | 1y to 5y linear trend | Baseline to 5y |
| BMI (kg/m2) | ||||||||||
| Gastric Bypass | 52.9 (45.8, 59.9) N=161 |
39.4 (32.8, 46.3) N=143 |
35.8 (30.6, 42.7) N=144 |
35.5 (30.5, 44.0) N=135 |
36.4 (30.4, 44.9) N=130 |
37.5 (31.6, 43.2) N=129 |
39.0 (32.0, 48.2) N=134 |
<0.0001 | 0.002 | <0.0001 |
| Sleeve Gastrectomy | 48.0 (45.1, 52.9) N=65 |
35.8 (32.5, 39.7) N=53 |
33.7 (29.7, 37.7) N=58 |
33.7 (29.3, 38.1) N=51 |
34.7 (29.5, 40.3) N=45 |
34.7 (30.9, 39.8) N=51 |
37.0 (32.1, 40.8) N=49 |
<0.0001 | 0.008 | <0.0001 |
| Ferritin (ug/L) | ||||||||||
| Gastric Bypass | 39.0 (24.5, 72.0) N=160 |
27.0 (15.0, 48.5) N=136 |
18.5 (9.0, 31.0) N=142 |
9.0 (6.0, 20.0) N=132 |
8.0 (4.0, 16.0) N=129 |
7.0 (4.0, 15.0) N=120 |
6.0 (4.0, 13.0) N=122 |
<0.0001 | <0.0001 | <0.0001 |
| Sleeve Gastrectomy | 30.0 (18.0, 52.0) N=63 |
36.0 (15.5, 60.0) N=52 |
27.0 (12.0, 54.0) N=55 |
23.0 (9.0, 37.0) N=49 |
18.0 (9.0, 33.5) N=44 |
14.0 (6.0, 37.0) N=49 |
12.0 (7.0, 29.0) N=42 |
ns 0.98 |
0.0002 | 0.002 |
| Transferrin (mg/mL) | ||||||||||
| Gastric Bypass | 266 (245, 290) N=160 |
280 (250, 302) N=136 |
284 (257, 329) N=142 |
308 (278, 350) N=132 |
326 (292, 362) N=129 |
332 (298, 372) N=120 |
330 (307, 367) N=122 |
0.0008 | <0.0001 | <0.0001 |
| Sleeve Gastrectomy | 274 (242, 307) N=63 |
263 (233, 305) N=51 |
277 (239, 308) N=55 |
277 (249, 314) N=49 |
281 (250, 324) N=44 |
291 (267, 324) N=49 |
304 (266, 345) N=42 |
ns 0.99 |
0.0006 | ns 0.09 |
| Vitamin B12 (pg/mL) | ||||||||||
| Gastric Bypass | 411 (305, 571) N=159 |
356 (262, 537) N=136 |
318 (207, 519) N=142 |
282 (198, 426) N=132 |
286 (188, 387) N=129 |
251 (174, 408) N=120 |
268 (183, 390) N=122 |
ns 0.06 |
0.01 | <0.0001 |
| Sleeve Gastrectomy | 525 (382, 722) N=63 |
417 (268, 517) N=52 |
330 (233, 497) N=55 |
384 (238, 527) N=49 |
378 (240, 504) N=44 |
336 (245, 484) N=49 |
396 (267, 579) N=42 |
0.004 | ns 0.41 |
ns 0.35 |
| Vitamin B1 (erythrocyte transketolase activity coefficient) | ||||||||||
| Gastric Bypass | 1.0 (1.0, 1.07) N=154 |
1.00 (1.00, 1.06) N=133 |
1.01 (1.00, 1.08) N=137 |
1.00 (1.00, 1.07) N=126 |
1.01 (1.00, 1.08) N=127 |
1.00 (1.00, 1.09) N=116 |
1.00 (1.00, 1.05) N=113 |
ns 0.67 |
0.04 | ns 0.99 |
| Sleeve Gastrectomy | 1.00 (1.00, 1.07) N=61 |
1.02 (1.00, 1.12) N=51 |
1.00 (1.00, 1.10) N=56 |
1.00 (1.00, 1.08) N=48 |
1.00 (1.00, 1.10) N=44 |
1.00 (1.00, 1.04) N=43 |
1.00 (1.00, 1.04) N=39 |
ns 0.99 |
ns 0.07 |
ns 0.83 |
| Folate (ug/mL) | ||||||||||
| Gastric Bypass | 14.2 (10.7, 18.9) N=158 |
11.2 (6.9, 17.4) N=136 |
13.2 (8.2, 18.9) N=142 |
13.7 (9.9, 17.8) N=131 |
14.2 (10.4, 20.0) N=129 |
15.0 (11.8, 22.0) N=120 |
17.0 (11.9, 22.0) N=122 |
ns 0.60 |
<0.0001 | 0.03 |
| Sleeve Gastrectomy | 17.4 (11.7, 20.0) N=62 |
11.6 (6.8, 18.4) N=52 |
11.2 (6.3, 20.0) N=54 |
13.0 (9.3, 20.4) N=49 |
11.8 (9.5, 22.0) N=44 |
14.1 (9.8, 21.4) N=48 |
13.6 (9.7, 17.9) N=42 |
0.03 | ns 0.12 |
ns 0.75 |
| Vitamin A (ug/L) | ||||||||||
| Gastric Bypass | 430 (370, 515) N=158 |
382 (313, 466) N=134 |
400 (327, 487) N=142 |
402 (330, 507) N=131 |
393 (331, 488) N=127 |
396 (312, 484) N=120 |
386 (336, 479) N=121 |
ns 0.85 |
ns 0.31 |
ns 0.38 |
| Sleeve Gastrectomy | 436 (369, 508) N=61 |
398 (362, 505) N=50 |
422 (370, 474) N=55 |
419 (362, 487) N=48 |
429 (362, 512) N=44 |
425 (361, 500) N=49 |
453 (393, 520) N=43 |
ns 0.99 |
ns 0.58 |
ns 0.99 |
| 25-OH Vitamin D (ng/mL) | ||||||||||
| Gastric Bypass | 21.4 (15.5, 28.0) N=159 |
24.8 (17.4, 32.2) N=134 |
23.4 (17.0, 31.4) N=142 |
20.5 (14.0, 29.6) N=131 |
20.2 (13.1, 26.8) N=129 |
19.3 (13.6, 28.4) N=120 |
19.7 (12.5, 27.6) N=119 |
ns 0.22 |
0.02 | ns 1.00 |
| Sleeve Gastrectomy | 25.0 (21.2, 32.7) [N=62 |
26.6 (22.2, 36.3) N=51 |
27.1 (20.2, 35.8) N=55 |
23.0 (17.7, 29.4) N=49 |
22.8 (18.3, 28.6) [N=44 |
22.6 (17.8, 25.8) N=48 |
23.2 (16.9, 29.1) N=42 |
ns 0.99 |
0.008 | ns 0.41 |
| PTH (pg/mL) | ||||||||||
| Gastric Bypass | 44.0 (34.0, 63.0) N=159 |
41.0 (32.0, 50.0) N=135 |
46.0 (34.0, 58.0) N=142 |
51.0 (41.0, 65.0) N=131 |
54.0 (41.0, 72.0) N=129 |
57.0 (40.0, 75.0) N=118 |
59.0 (44.0, 72.0) N=122 |
ns 0.99 |
<0.0001 | 0.0002 |
| Sleeve Gastrectomy | 37.5 (27.0, 47.0) N=62 |
31.0 (25.0, 37.0) N=62 |
32.0 (28.0, 52.0) N=55 |
37.0 (30.0, 43.0) N=49 |
33.5 (27.5, 44.5) N=44 |
40.0 (29.0, 53.0) N=47 |
37.0 (32.0, 45.0) N=41 |
ns 0.99 |
ns 0.52 |
ns 0.94 |
| Albumin (g/dL) | ||||||||||
| Gastric Bypass | 4.1 (3.9, 4.3) N=160 |
4.2 (4.0, 4.4) N=138 |
4.2 (4.0, 4.4) N=142 |
4.3 (4.1, 4.5) N=133 |
4.3 (4.1, 4.5) N=128 |
4.2 (4.0, 4.5) N=122 |
4.2 (4.1, 4.4) N=122 |
0.003 | ns 0.76 |
0.03 |
| Sleeve Gastrectomy | 4.3 (4.0, 4.5) [N=63 |
4.3 (4.1, 4.5) N=52 |
4.3 (4.1, 4.6) N=55 |
4.4 (4.1, 4.5) N=49 |
4.2 (4.0, 4.4) N=44 |
4.3 (4.1, 4.5) N=49 |
4.3 (4.0, 4.6) N=44 |
ns 0.98 |
ns 0.11 |
ns 1.00 |
| hs-CRP (mg/dL) | ||||||||||
| Gastric Bypass | 0.65 (0.32, 1.20) N=160 |
0.22 (0.08, 0.55) N=137 |
0.09 (0.04, 0.29) N=142 |
0.06 (0.03, 0.24) N=131 |
0.08 (0.03, 0.19) N=129 |
0.07 (0.02, 0.38) N=121 |
0.12 (0.05, 0.36) N=121 |
<0.0001 | ns 0.40 |
<0.0001 |
| Sleeve Gastrectomy | 0.45 (0.19, 0.85) N=63 |
0.14 (0.06, 0.47) N=52 |
0.09 (0.03, 0.45) N=55 |
0.05 (0.03, 0.12) N=49 |
0.16 (0.04, 0.50) N=44 |
0.11 (0.04, 0.34) [N=49 |
0.09 (0.05, 0.63) N=43 |
0.001 | ns 0.06 |
0.01 |
Median (25th, 75th percentile)
P-values are from generalized linear mixed models performed using log transformed (ferritin, B12, PTH, hs-CRP) or untransformed data (all others). Tukey-Kramer adjustment used when testing differences between baseline and year 1 and baseline and year 5 time-points. A linear model was fitted to test for trend between year 1 and year 5.
Median levels and IQR of all nutrition related-biomarkers over the 5-year period by surgery group are shown in Figure 1 and Table 2. Prevalence with 95% confidence intervals of abnormal nutritional biomarkers are shown in Figure 2 and Supplemental Table 1.
Figure 1:
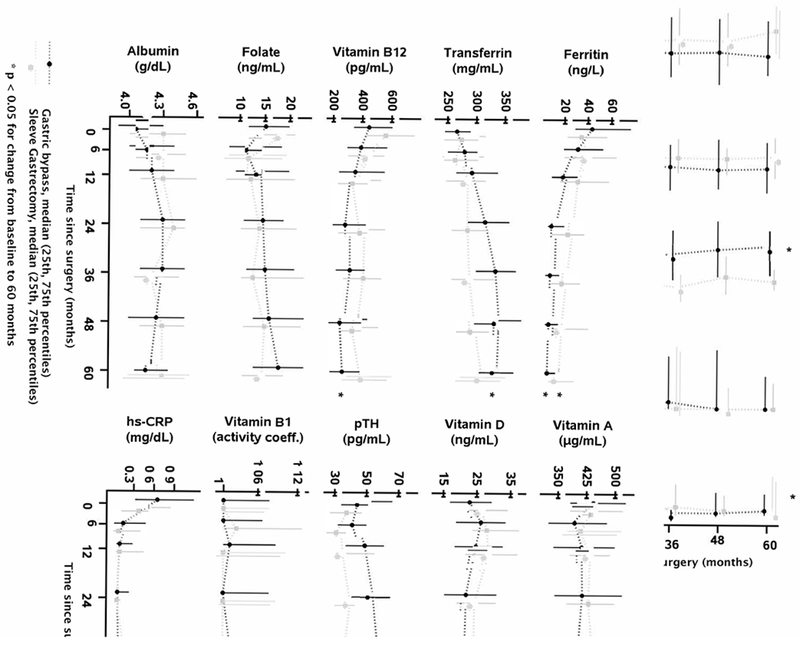
Nutritional measures by surgery group over time. * change from baseline to 5 years p<0.05.
Figure 2:
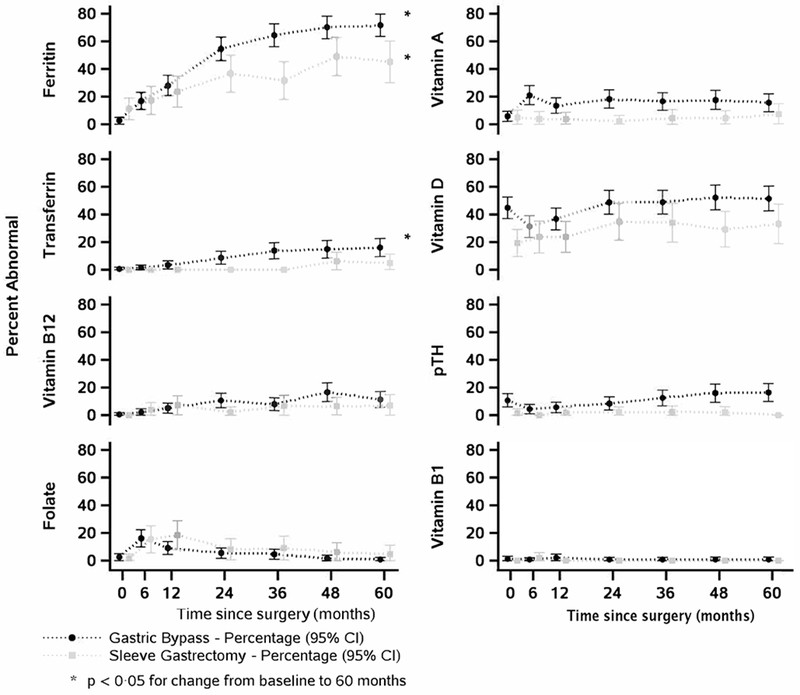
Prevalence of abnormal values by surgery group. * change from baseline to 5 years p<0.05.
Iron status
By 5 years, ferritin levels had decreased and hypoferritinemia had increased significantly after both RYGB and VSG. In the first year, iron status worsened significantly only after RYGB, but thereafter, significant changes occurred after both procedures. Correspondingly, transferrin levels increased significantly across all periods after RYGB, while prevalence of high transferrin increased significantly after year 1. Transferrin levels increased significantly 1 to 5 years after VSG, though the prevalence of high transferrin remained low, with non-estimable changes.
Because inflammation can increase ferritin, we assessed hs-CRP levels, which declined significantly in the first year after both RYGB and VSG then remained stable thereafter.
B vitamins and folate
After RYGB, net vitamin B12 levels declined significantly (Figure 1), after a non-significant decline in the first year (p=0.06). Though prevalence of low B12 increased significantly after year 1, the net increase was not significant (p=0.06, Figure 2). In contrast, after VSG, there was no significant net decline in vitamin B12 levels, despite a significant decline in the first year. Changes in prevalence of low vitamin B12 were not estimable or non-significant after VSG due to the small proportion of low values.
Vitamin B1 status (erythrocyte transketolase activity) did not change following either surgery, with low prevalence of abnormal activity at all time points.
After RYGB, there was a transient decline in folate levels and an increase in low folate at 6 months (Figures 1 and 2) but no net change at 1 year. Thereafter, folate levels increased significantly, resulting in a significant net increase from baseline. There was no net change in prevalence of low folate from baseline to year 5, despite a significant decline after year 1. After VSG, folate levels significantly declined by 1 year, then stabilized with no significant overall change. There was also no net change in prevalence of low folate.
Vitamins A and D, and parathyroid hormone
There was no significant net or interval change in vitamin A levels or low vitamin A after RYGB or VSG, despite a transient increase in low vitamin A levels 6 months after RYGB (Figure 2).
There was no net change in 25OH-vitamin D levels after either procedure, though levels significantly declined from year 1 onwards. Likewise, there was no net change in prevalence of vitamin D deficiency after either procedure, despite an upwards trend 1 year after RYGB.
Conversely, PTH levels increased significantly over 5 years after RYGB. The prevalence of elevated PTH also increased between 1 and 5 years. After VSG, PTH levels were unchanged and prevalence of elevated PTH remained very low, with no estimable differences.
Serum albumin
Serum albumin levels increased in the first year after RYGB, then remained stable. There were no significant changes after VSG. The proportion of patients with hypoalbuminemia was very low after both procedures.
Multiple nutritional deficiencies
The proportion of patients with ≥2 nutritional deficiencies increased over 5 years after RYGB (from 12% to 59%, p<0.0001), but not VSG (from 6% to 27%, p=0.09) [Supplemental Figure 1]. Likewise, the prevalence of ≥3 nutritional deficiencies increased following RYGB (from 3% to 19%, p=0.0005), but remained very low after VSG (from 2% to 2.3%).
Nutritional supplements and nutritionally-relevant medications
Reported intake of recommended nutritional supplements (multivitamin, calcium, vitamin D, iron, B12) varied by supplement type and over time (Supplemental Table 2). Multivitamin use declined from 74% at baseline to 53% by year 5. Intake of other supplements was lower at baseline (range 14% to 38%), increased by 6 months, but then steadily declined by year 5, except for iron.
Acid suppressant medication was taken by 15% of participants at baseline, increased to 32% at 6 months, then declined steadily to 7% at 5 years. Metformin usage decreased from 26% at baseline to ≤4% thereafter.
Risk factors associated with nutritional deficiencies
Multivariable models identified factors associated with nutritional biomarker levels (Table 3) and odds of abnormal nutritional values (Table 4) from 1 to 5 years post-operatively. Models predicting abnormal B12 values did not converge.
Table 3.
Clinical and demographic predictors of nutrient levels*
| Ferritin (log) | Transferrin | Vitamin B12 (log) | Folate | Vitamin A | Vitamin D | PTH (log) | |
|---|---|---|---|---|---|---|---|
| Surgery type: | |||||||
| Gastric Bypass | −0.26 (0.08) | 17.2 (4.28) | −0.28 (0.06) | −0.06 (0.49) | −26.9 (10.4) | 0.18 (0.86) | 0.24 (0.04) |
| Sleeve Gastrectomy | 0 p=0.002 |
0 p<0.0001 |
0 p<0.0001 |
0 p=0.89 |
0 p=0.01 |
0 p=0.83 |
0 p<0.0001 |
| Visit: | |||||||
| Year 1 | 0 | 0 | 0 | 0 | 0 | 0 | 0 |
| Year 2 | −0.26 (0.10) | 6.76 (5.13) | −0.04 (0.07) | 0.47 (0.59) | −10.3 (13.2) | −0.06 (1.08) | 0.02 (0.05) |
| Year 3 | −0.53 (0.10) | 21..2 (5.32) | −0.03 (0.07) | 1.18 (0.61) | −14.4 (13.6) | 0.38 (1.12) | 0.02 (0.05) |
| Year 4 | −0.62 (0.11) | 30.0 (5.40) | −0.10 (0.07) | 2.06 (0.62) | −26.9 (13.7) | 0.11 (1.13) | 0.07 (0.05) |
| Year 5 | −0.69 (0.11) p<0.0001 |
34.1 (5.45) p<0.0001 |
−0.03 (0.07) p=0.74 |
2.54 (0.62) p<0.0001 |
−15.7 (13.9) p=0.40 |
0.31 (1.14) p=0.99 |
0.12 (0.05) p=0.13 |
| Sex: | |||||||
| Female | −0.62 (0.07) | 24.9 (3.64) | 0.003 (0.05) | 1.00 (0.42) | 5.46 (9.24) | 1.89 (0.76) | 0.01 (0.04) |
| Male (reference) | 0 p<0.0001 |
0 p<0.0001 |
0 p=0.95 |
0 p=0.02 |
0 p=0.55 |
0 p=0.01 |
0 p=0.70 |
| Race: | |||||||
| Black | 0.19 (0.08) | −15.3 (3.95) | 0.03 (0.05) | −0.94 (0.45) | −35.5 (10.0) | −5.02 (0.84) | 0.13 (0.04) |
| Other | 0.22 (0.13) | −14.6 (6.77) | 0.13 (0.09) | −1.54 (0.80) | 1.47 (17.0) | −3.26 (1.44) | 0.04 (0.07) |
| White (reference) | 0 p=0.02 |
0 P=0.0002 |
0 p=0.37 |
0 p=0.03 |
0 P=0.002 |
0 p<0.0001 |
0 P=0.001 |
| Education: | |||||||
| HS graduate | 0.17 (0.12) | 1.49 (5.90) | 0.12 (0.08) | 0.05 (0.67) | 19.4 (15.0) | −0.94 (1.23) | −0.04 (0.06) |
| College | −0.01 (0.12) | 8.12 (5.86) | 0.14 (0.08) | −0.07 (0.67) | 6.73 (14.8) | −0.58 (1.22) | 0.004 (0.06) |
| College graduate | 0.18 (0.13) | 1.58 (6.43) | 0.13 (0.09) | 0.51 (0.74) | 26.5 (16.2) | −0.88 (1.34) | −0.05 (0.06) |
| <High school (reference) | 0 p=0.04 |
0 p=0.23 |
0 p=0.35 |
0 p=0.72 |
0 p=0.19 |
0 p=0.87 |
0 p=0.54 |
| Weight change (+5 kg/y) | −0.03 (0.01) p=0.04 |
2.42 (0.71) p=0.0007 |
0.009 (0.01) p=0.37 |
0.32 (0.08) p=0.0001 |
5.17 (1.81) p=0.004 |
−0.47 (0.15) p=0.002 |
0.02 (0.01) p=0.02 |
| Acid suppression | −0.03 (0.10) p=0.74 |
2.14 (5.00) p=0.67 |
−0.002 (0.07) p=0.98 |
NA | NA | NA | NA |
| hsCRP | 0.31 (0.05) p<0.0001 |
−9.45 (2.50) p=0.0002 |
NA | NA | NA | NA | NA |
| Multivitamin supplements/wk: | |||||||
| <7 | |||||||
| 7-14 | −0.07 (0.09) | 1.97 (4.44) | 0.008 (0.07) | 1.41 (0.51) | −8.85 (11.3) | 3.26 (0.98) | −0.02 (0.05) |
| 14+ | −0.07 (0.08) | −1.26 (3.89) | 0.10 (0.06) | 2.35 (0.45) | 6.77 (9.95) | 4.00 (0.90) | −0.06 (0.05) |
| 0 (reference) | 0.22 (0.10) 0 p=0.05 |
−2.39 (5.26) 0 p=0.85 |
0.26 (0.07) 0 p=0.003 |
2.57 (0.60) 0 p<0.0001 |
34.4 (13.3) 0 p=0.02 |
5.47 (1.15) 0 p<0.0001 |
−0.09 (0.06) 0 p=0.43 |
| Vitamin D supplements/wk: | NA | NA | NA | NA | NA | ||
| <7 | 1.17 (1.02) | −0.10 (0.05) | |||||
| 7+ | 4.51 (0.95) | 0.005 (0.05) | |||||
| 0 (reference) | 0 p<0.0001 |
0 p=0.12 |
|||||
| Vitamin B12 supplements/wk: | NA | NA | NA | NA | NA | NA | |
| <7 | |||||||
| 7+ | 0.07 (0.07) | ||||||
| 0 (reference) | 0.30 (0.07) 0 p<0.0001 |
||||||
| Calcium supplements/wk: | NA | NA | NA | NA | NA | ||
| <7 | −0.07 (0.06) | ||||||
| 7-14 | 0.02 (0.05) | ||||||
| 14+ | 0.01 (0.05) | ||||||
| 0 (reference) | 0 p=0.53 |
Nutrient level is modelled as either raw or log value showing beta estimate (standard error). P-values reflect test for overall significance of each variable.
Table 4.
Clinical and demographic predictors of abnormal nutrient values*
| Ferritin | Transferrin | Folate | Vitamin A | Vitamin D | PTH | |
|---|---|---|---|---|---|---|
| Surgery type: | ||||||
| Gastric Bypass | 2.88 (1.57, 5.26) | 3.76 (1.19, 11.9) | 0.49 (0.21, 1.13) | 4.57 (1.91, 10.9) | 1.93 (0.99, 3.77) | 5.91 (2.03, 17.2) |
| Sleeve Gastrectomy (reference) | 1.0 p=0.001 |
1.0 p=0.008 |
1.0 p=0.15 |
1.0 p=0.0005 |
1.0 p=0.06 |
1.0 P=0.0005 |
| Visit: | ||||||
| Year 1 | 1.0 | 1.0 | 1.0 | 1.0 | 1.0 | 1.0 |
| Year 2 | 2.10 (1.12, 3.94) | 2.14 (0.38, 12.0) | 0.95 (0.34, 2.65) | 1.64 (0.65, 4.12) | 0.95 (0.48, 1.90) | 1.33 (0.46, 3.86) |
| Year 3 | 2.66 (1.27, 5.57) | 4.21 (0.74, 23.8) | 1.08 (0.30, 3.90) | 1.42 (0.53, 3.82) | 0.70 (0.31, 1.62) | 1.93 (0.61, 6.04) |
| Year 4 | 4.39 (2.09, 9.22) | 4.68 (0.85, 26.0) | 0.40 (0.08, 2.07) | 1.69 (0.59, 4.84) | 0.77 (0.36, 1.69) | 2.07 (0.64, 6.64) |
| Year 5 | 4.94 (2.36, 10.3) p<.0001 |
5.56 (1.05, 29.5) p=0.01 |
0.19 (0.03, 1.28) p=0.009 |
1.65 (0.51, 5.39) p=0.61 |
0.87 (0.39, 1.92) p=0.68 |
2.38 (0.75, 7.55) p=0.31 |
| Sex: | ||||||
| Female | 1.47 (0.80, 2.68) | 3.58 (0.85, 15.1) | 0.68 (0.28, 1.67) | 1.07 (0.53, 2.15) | 0.73 (0.43, 1.26) | 1.90 (0.79, 4.97) |
| Male (reference) | 1.0 p=0.22 |
1.0 p=0.08 |
1.0 p=0.44 |
1.0 p=0.86 |
1.0 p=0.26 |
1.0 p=0.13 |
| Race: | ||||||
| Black | 1.07 (0.52, 2.17) | 0.55 (0.15, 2.02) | 0.33 (0.09, 1.27) | 2.47 (1.11, 5.51) | 4.12 (2.04, 8.34) | 2.03 (0.74, 5.56) |
| Other | 1.07 (0.38, 2.98) | 0.51 (0.12, 2.13) | 2.03 (0.55, 7.53) | 1.42 (0.29, 6.95) | 1.35 (0.31, 5.95) | 1.78 (0.24, 12.9) |
| White (reference) | 1.0 p=0.97 |
1.0 p=0.30 |
1.0 p=0.045 |
1.0 p=0.06 |
1.0 P=0.0002 |
1.0 p=0.29 |
| Education: | ||||||
| HS graduate | 0.74 (0.30, 1.82) | 1.92 (0.12, 31.8) | 1.23 (0.20, 7.46) | 0.87 (0.16, 4.79) | 1.75 (0.56, 5.41) | 0.60 (0.12, 2.90) |
| College | 0.92 (0.38, 2.26) | 4.26 (0.29, 63.5) | 0.93 (0.19, 4.55) | 2.05 (0.41,10.1) | 1.26 (0.44, 3.59) | 0.82 (0.21, 3.26) |
| College graduate | 0.66 (0.25, 1.76) | 3.14 (0.20, 50.5) | 0.43 (0.06, 3.07) | 0.60 (0.09, 3.88) | 1.27 (0.39, 4.14) | 0.33 (0.06, 1.94) |
| <High school (reference) | 1.0 p=0.63 |
1.0 p=0.19 |
1.0 p=0.33 |
1.0 p=0.04 |
1.0 p=0.59 |
1.0 p=0.30 |
| Weight change (+5 kg/y) | 1.08 (0.99, 1.17) p=0.08 |
1.01 (0.86, 1.20) p=0.87 |
0.83 (0.73, 0.94) p=0.01 |
0.92 (0.82, 1.02) p=0.12 |
1.14 (1.04, 1.25) p=0.005 |
1.08 (0.93, 1.25) p=0.34 |
| Acid suppression | 1.19 (0.63, 2.27) p=0.59 |
0.51 (0.13, 1.92) p=0.24 |
NA | NA | NA | NA |
| hsCRP | 0.47 (0.33, 0.68) p=0.0006 |
0.80 (0.45, 1.41) p=0.39 |
NA | NA | NA | NA |
| Multivitamin supplements/wk: | ||||||
| <7 | 1.02 (0.52, 1.96) | 0.88 (0.33, 2.34) | 0.87 (0.30, 2.51) | 0.97 (0.38, 2.47) | 0.49 (0.23, 1.02) | 0.80 (0.19, 3.37) |
| 7-14 | 0.76 (0.43, 1.34) | 0.93 (0.36, 2.42) | 0.61 (0.23, 1.66) | 0.87 (0.38, 2.02) | 0.38 (0.19, 0.74) | 1.01 (0.27, 3.75) |
| 14+ | 0.51 (0.24, 1.07) | 0.63 (0.16, 2.59) | 0.73 (0.20, 2.68) | 0.73 (0.28, 1.91) | 0.38 (0.16, 0.91) | 0.68 (0.16, 2.82) |
| 0 (reference) | 1.0 p=0.11 |
1.0 p=0.77 |
1.0 p=0.66 |
1.0 p=0.85 |
1.0 p=0.004 |
1.0 p=0.71 |
| Vitamin D supplements/wk: | NA | NA | NA | NA | ||
| <7 | 0.47 (0.21, 1.04) | 0.38 (0.10, 1.37) | ||||
| 7+ | 0.50 (0.26, 0.95) | 0.93 (0.27, 3.25) | ||||
| 0 (reference) | 1.0 p=0.01 |
1.0 p=0.15 |
||||
| Vitamin B12 supplements/wk: | NA | NA | NA | NA | NA | NA |
| <7 | ||||||
| 7+ | ||||||
| 0 (reference) | ||||||
| Calcium supplements/wk: | NA | NA | NA | NA | NA | |
| <7 | 0.38 (0.02, 5.89) | |||||
| 7-14 | 1.19 (0.37, 3.83) | |||||
| 14+ | 0.91 (0.22, 3.72) | |||||
| 0 (reference) | 1.0 p=0.45 |
P-values reflect test for overall significance of each variable.
Compared to VSG, RYGB was associated with lower ferritin and higher transferrin levels, lower vitamin B12, vitamin A and PTH levels, and higher risk of abnormal values of ferritin, transferrin, vitamin A, and PTH.
Compared to male sex, female sex was associated with lower ferritin and higher transferrin levels, but higher folate and 25OH-vitamin D levels. There was no difference in risk of abnormal values by sex.
Compared to white race, black race was associated with higher ferritin and lower transferrin, but lower folate, vitamin A and 25OH-D, and higher PTH levels.
Weight gain (+5 kg/year) between visits was associated with lower ferritin and higher transferrin levels, but not with higher odds of abnormal values. Interval weight gain also was associated with lower 25OH-D and higher PTH levels, and higher odds of vitamin D deficiency. Conversely, interval weight gain was associated with higher folate and vitamin A levels and lower odds of low folate.
Acid suppression medication intake was not associated with iron or vitamin B12 status. Higher hs-CRP was significantly associated with higher ferritin, lower transferrin levels and reduced odds of low ferritin.
Greater multivitamin intake was associated with higher ferritin, vitamin B12, folate, vitamin A, and 25OH-D levels and reduced odds of vitamin D deficiency. Increasing frequency of oral vitamin B12 supplementation was positively associated with higher B12 levels. Similarly, increasing intake of vitamin D was associated with higher 25OH-D levels and lower odds of vitamin D deficiency. Vitamin D and calcium supplementation were not associated with PTH levels or abnormal PTH.
Among the 170 female participants, 49 visits occurred ≤6 months of a pregnancy: 36 visits after GB and 13 visits after VSG. Pregnancy was associated with higher transferrin (beta estimate ± standard error 26.0 ± 7.03, p=0.0002), higher odds of high transferrin (odds ratio 4.65, 95% CI: 1.95, 11.1, p=0.01) and lower vitamin B12 (beta estimate −0.26 ± 0.10, p=0.01), but no other nutrient markers. Menstrual frequency and iron status were not associated.
DISCUSSION
Bariatric surgery is increasingly recommended for adolescents suffering from severe obesity to achieve significant, sustained weight loss and resolve comorbid diseases.9, 10, 16 However, the considerable metabolic benefits are tempered by a risk of developing nutritional deficiencies due to altered gastrointestinal physiology and dietary intake. Systematic assessment in adolescents has been limited, particularly after VSG, now the most commonly performed procedure across all ages.9, 10 Yet, adolescents may be at heightened risk due to low adherence to supplementation and a longer potential lifespan with altered physiology.6 Associated clinical and demographic risk factors, needed to inform screening, prevention and treatment strategies, are unknown. We addressed these gaps by examining nutritional outcomes over 5 years in a large multicenter prospective cohort of adolescents who received RYGB or VSG.
The most prevalent abnormality we observed was hypoferritinemia, which affected nearly twice as many RYGB recipients by year 5 compared to VSG. Vitamin B12 status likewise worsened disproportionately after RYGB, despite similar trajectories of weight loss after VSG. This suggests that the differential risk is due to anatomical and physiological differences between procedures, rather than weight loss alone. In aggregate, RYGB was associated with a striking 5-fold increase in ≥2 deficiencies and 6-fold increase in ≥3 deficiencies by 5 years. VSG resulted in a 4-fold, though non-significant, increase in ≥2 deficiencies, supporting a lower, but not negligible, nutritional risk.
The increase in iron and B12 deficiencies after RYGB in our cohort are aligned with those reported in a 5-year longitudinal Swedish cohort of 81 adolescents undergoing RYGB.10 In that cohort, the prevalence of low ferritin and/or iron increased from 24% at baseline to 66% at 5 years, compared to a hypoferritinemia prevalence of 71% at 5 years in our RYGB group. Vitamin B12 deficiency was rare preoperatively (≤1%) in both cohorts, but increased to 22% in the Swedish study vs. 12% in our cohort. Vitamin D deficiency was common at baseline in both cohorts and did not appreciably change.
High rates of iron and vitamin B12 deficiency have also been reported in adults after bariatric surgery.3 Reported iron deficiency ranged from 22-45% after RYGB and 18-36% after VSG in adults, somewhat lower than in our study. The prevalence of vitamin B12 deficiency in adults is comparable, and generally higher after RYGB (9%-42%) than VSG (5-15%).4 In addition to adherence to supplementation6, multiple factors can impact nutritional status, including inadequate dietary intake, supplement formulation, coadministration with other supplements (e.g. vitamin C with iron), impaired digestion or absorption resulting from bypassing the proximal small intestine, small intestinal bacterial overgrowth, and reduced gastric acid production.17, 18 Over time, deficiencies in iron and B12 can lead to anemia, fatigue, exercise intolerance, neurological dysfunction, and infertility, but the long-term risk of these outcomes among adolescent recipients remains unknown.19
Both adults and adolescents have high rates of vitamin D deficiency pre- and post-operatively, raising long-term concern for impaired bone health and fracture risk.2, 20 The preoperative prevalence of vitamin D deficiency in our cohort (37%) was lower than rates reported in adult bariatric cohorts (range 60-80%)3, 4, which may, in part, reflect age-specific or secular trends in increased vitamin D supplementation.21 Other preoperative micronutrient deficiencies were uncommon in our cohort, in contrast with higher preoperative rates reported in adults (B12, thiamin, folate and iron).3, 4
Our study is the first to assess comparative nutritional outcomes in adolescents after both VSG and RYGB. VSG is now the predominant bariatric surgery in adolescents and adults due to limited anatomical alteration, lower operative risk, and presumed lower risk of nutritional deficits.22 Our results now provide critical evidence that VSG does in fact carry significantly lower nutritional risk than RYGB, but can still worsen iron status.
Some nutrient levels declined acutely only during the 6-12 months of rapid weight loss, and then either improved (folate) or remained low (vitamin A after RYGB). We previously found that dietary intakes of calcium, iron, folate, zinc and vitamins A and D were reduced in the first year after bariatric surgery.23 Our findings support the recommendation to avoid pregnancy in the first 1-2 years after surgery and to carefully monitor nutritional status, dietary intake and supplementation during pregnancy.24
Recognizing that dietary intake and composition in the first postoperative year may not reflect long-term intake23, 25, we also assessed changes in nutritional status from 1 to 5 years to determine if risk evolves over time. The continued increase in iron, B12 (RYGB only), vitamin D deficiencies and abnormal PTH (RYGB only) after the first postoperative year is particularly worrisome, given the longer potential lifespan of these youth. Additionally, we identified risk factors associated with worsening nutritional status after the first year. These included RYGB (iron, B12, vitamin A and PTH status), female sex (iron), interval weight regain after the first year (iron, vitamin D, PTH), and black race (vitamin A, vitamin D, PTH). We hypothesize that higher risk associated with weight regain could in part be due to higher intake of high calorie, nutrient-poor processed foods, and for low vitamin D, the known association with worsening obesity.26 Racial variation in iron and vitamin D status have been reported in other cohorts and merits investigation to determine mechanisms.26, 27 Pregnancy was also a risk factor for worse iron and vitamin B12 status. Notably, acid suppression was not related to iron or vitamin B12 measures. Inflammation, as measured by hs-CRP, was related to higher ferritin and lower transferrin levels, emphasizing the need to account for inflammation when using these measures. As expected, increased intake of multivitamin, B12 and D supplements was associated with better nutritional measures, underscoring the importance of adequate supplementation and promoting adherence.
Strengths of our study include the multicenter prospective design, high retention, standardized data collection and use of a central laboratory. Limitations included some missing data, however we employed a robust statistical approach. We were also limited to available nutritional measures, which precluded fully characterizing iron and vitamin B12 nutriture. In addition, other nutrients including copper, zinc and vitamin E were not assessed.3 Self-reported supplement intake is likely to have appreciable error, possibly biasing findings towards the null, and data on dietary intake and non-recommended supplement intake were lacking.
In summary, bariatric surgery in adolescents was associated with increasing prevalence of several nutritional deficiencies over 5 years, with greater risk after RYGB, particularly for iron and B12 deficiency. In addition to surgical type and inadequate supplement intake, weight regain, black race and pregnancy were associated with heightened risk for selected deficiencies. Our findings underscore the importance of long-term nutritional monitoring in adolescents after bariatric surgery and the need to examine impact on health outcomes and quality of life as these youth advance into adulthood, including systematic assessment of anemia and bone health. The lower, albeit not negligible, nutritional risk of VSG also highlights the importance of examining nutritional outcomes in recipients of endoscopic sleeve and other bariatric procedures, as their use is likely to increase.
Supplementary Material
Supplemental Figure 1: Proportion of patients with 0, 1, 2 or 3 nutritional deficiencies after RYGB and VSG.
Supplemental Online Table 1: Prevalence of abnormal nutritional measures after RYGB or VSG.
Supplemental Online Table 2: Reported intake of supplements, medications, pregnancy and menstrual frequency [n/N (%)]
What You Need to Know.
Background:
Little is known about nutritional deficiencies in adolescents after metabolic bariatric surgery.
Findings:
In a prospective study of adolescents who underwent RYGB or VSG, we observed nutritional deficiencies by 5 y after the procedures—particularly in iron and B12 after RYGB.
Implications for patient care:
Adolescents who undergo bariatric surgery should be monitored for nutrient deficiencies.
ACKNOWLEDGEMENTS
We gratefully acknowledge the commitment of the Teen-LABS participants and study personnel.
Grant support: This study was conducted as a cooperative agreement and funded by the National Institute of Diabetes and Digestive and Kidney Diseases U01 DK072493/ UM1 DK072493 and UM1 DK095710. The research was also supported in part by the National Center for Advancing Translational Sciences of the National Institutes of Health under Award Number UL1 TR001425. The content is solely the responsibility of the authors and does not necessarily represent the official views of the National Institutes of Health.
Disclosures: Anita Courcoulas receives research grant support from Allurion, Inc.
These authors disclose no relevant conflicts: Mary Brandt, Mike Chen, Carroll Harmon, Michael Helmrath, Thomas Inge, Todd Jenkins, Heidi Kalkwarf, Jane Khoury, Marc Michalsky, Avani Modi, Stavra Xanthakos.
Abbreviations:
- BMI
body mass index
- RYGB
Roux-en-Y gastric bypass
- GERD
gastroesophageal reflux disease
- hs-CRP
high sensitivity c-reactive protein
- NAFLD
nonalcoholic fatty liver disease
- PTH
parathyroid hormone
- PCOS
polycystic ovarian syndrome
- VSG
vertical sleeve gastrectomy
- 25-OH-D
25-hydroxyvitamin D
Footnotes
Publisher's Disclaimer: This is a PDF file of an unedited manuscript that has been accepted for publication. As a service to our customers we are providing this early version of the manuscript. The manuscript will undergo copyediting, typesetting, and review of the resulting proof before it is published in its final form. Please note that during the production process errors may be discovered which could affect the content, and all legal disclaimers that apply to the journal pertain.
Writing assistance: none
Clinical trial registration: Adolescent Bariatrics: Assessing Health Benefits and Risk (also known as Teen-Longitudinal Assessment of Bariatric Surgery [Teen-LABS]), NCT00474318
REFERENCES
- 1.Punchai S, Hanipah ZN, Meister KM, et al. Neurologic Manifestations of Vitamin B Deficiency after Bariatric Surgery. Obes Surg 2017;27:2079–2082. [DOI] [PubMed] [Google Scholar]
- 2.Yu EW, Lee MP, Landon JE, et al. Fracture Risk After Bariatric Surgery: Roux-en-Y Gastric Bypass Versus Adjustable Gastric Banding. J Bone Miner Res 2017;32:1229–1236. [DOI] [PMC free article] [PubMed] [Google Scholar]
- 3.Parrott J, Frank L, Rabena R, et al. American Society for Metabolic and Bariatric Surgery Integrated Health Nutritional Guidelines for the Surgical Weight Loss Patient 2016 Update: Micronutrients. Surg Obes Relat Dis 2017;13:727–741. [DOI] [PubMed] [Google Scholar]
- 4.Allied Health Sciences Section Ad Hoc Nutrition C, Aills L, Blankenship J, et al. ASMBS Allied Health Nutritional Guidelines for the Surgical Weight Loss Patient. Surg Obes Relat Dis 2008;4:S73–108. [DOI] [PubMed] [Google Scholar]
- 5.Pratt JSA, Browne A, Browne NT, et al. ASMBS pediatric metabolic and bariatric surgery guidelines, 2018. Surg Obes Relat Dis 2018;14:882–901. [DOI] [PMC free article] [PubMed] [Google Scholar]
- 6.Modi AC, Zeller MH, Xanthakos SA, et al. Adherence to vitamin supplementation following adolescent bariatric surgery. Obesity (Silver Spring) 2013;21:E190–5. [DOI] [PMC free article] [PubMed] [Google Scholar]
- 7.Inge TH, Jenkins TM, Xanthakos SA, et al. Long-term outcomes of bariatric surgery in adolescents with severe obesity (FABS-5+): a prospective follow-up analysis. Lancet Diabetes Endocrinol 2017;5:165–173. [DOI] [PMC free article] [PubMed] [Google Scholar]
- 8.Elhag W, El Ansari W, Abdulrazzaq S, et al. Evolution of 29 Anthropometric, Nutritional, and Cardiometabolic Parameters Among Morbidly Obese Adolescents 2 Years Post Sleeve Gastrectomy. Obes Surg 2018;28:474–482. [DOI] [PMC free article] [PubMed] [Google Scholar]
- 9.Inge TH, Courcoulas AP, Jenkins TM, et al. Weight Loss and Health Status 3 Years after Bariatric Surgery in Adolescents. N Engl J Med 2016;374:113–23. [DOI] [PMC free article] [PubMed] [Google Scholar]
- 10.Olbers T, Beamish AJ, Gronowitz E, et al. Laparoscopic Roux-en-Y gastric bypass in adolescents with severe obesity (AMOS): a prospective, 5-year, Swedish nationwide study. Lancet Diabetes Endocrinol 2017;5:174–183. [DOI] [PMC free article] [PubMed] [Google Scholar]
- 11.Skinner AC, Steiner MJ, Henderson FW, et al. Multiple markers of inflammation and weight status: cross-sectional analyses throughout childhood. Pediatrics 2010;125:e801–9. [DOI] [PMC free article] [PubMed] [Google Scholar]
- 12.Lam JR, Schneider JL, Quesenberry CP, et al. Proton Pump Inhibitor and Histamine-2 Receptor Antagonist Use and Iron Deficiency. Gastroenterology 2017;152:821–829 e1. [DOI] [PubMed] [Google Scholar]
- 13.Lam JR, Schneider JL, Zhao W, et al. Proton pump inhibitor and histamine 2 receptor antagonist use and vitamin B12 deficiency. JAMA 2013;310:2435–42. [DOI] [PubMed] [Google Scholar]
- 14.Liu Q, Li S, Quan H, et al. Vitamin B12 status in metformin treated patients: systematic review. PLoS One 2014;9:e100379. [DOI] [PMC free article] [PubMed] [Google Scholar]
- 15.Little RJA, Rubin DB. Statistical analysis with missing data. . New York: John Wiley & Sons, Inc., 1987. [Google Scholar]
- 16.Inge TH, Laffel LM, Jenkins TM, et al. Comparison of Surgical and Medical Therapy for Type 2 Diabetes in Severely Obese Adolescents. JAMA Pediatr 2018;172:452–460. [DOI] [PMC free article] [PubMed] [Google Scholar]
- 17.Gletsu-Miller N, Wright BN. Mineral malnutrition following bariatric surgery. Adv Nutr 2013;4:506–17. [DOI] [PMC free article] [PubMed] [Google Scholar]
- 18.Mischler RA, Armah SM, Craig BA, et al. Comparison of Oral Iron Supplement Formulations for Normalization of Iron Status Following Roux-EN-y Gastric Bypass Surgery: a Randomized Trial. Obes Surg 2018;28:369–377. [DOI] [PubMed] [Google Scholar]
- 19.Axelsson KF, Werling M, Eliasson B, et al. Fracture Risk After Gastric Bypass Surgery: A Retrospective Cohort Study. J Bone Miner Res 2018;33:2122–2131. [DOI] [PubMed] [Google Scholar]
- 20.Schafer AL, Kazakia GJ, Vittinghoff E, et al. Effects of Gastric Bypass Surgery on Bone Mass and Microarchitecture Occur Early and Particularly Impact Postmenopausal Women. J Bone Miner Res 2018;33:975–986. [DOI] [PMC free article] [PubMed] [Google Scholar]
- 21.Basatemur E, Horsfall L, Marston L, et al. Trends in the Diagnosis of Vitamin D Deficiency. Pediatrics 2017;139. [DOI] [PMC free article] [PubMed] [Google Scholar]
- 22.Inge TH, Coley RY, Bazzano LA, et al. Comparative effectiveness of bariatric procedures among adolescents: the PCORnet bariatric study. Surg Obes Relat Dis 2018;14:1374–1386. [DOI] [PMC free article] [PubMed] [Google Scholar]
- 23.Sarwer DB, Dilks RJ, Spitzer JC, et al. Changes in Dietary Intake and Eating Behavior in Adolescents After Bariatric Surgery: an Ancillary Study to the Teen-LABS Consortium. Obes Surg 2017;27:3082–3091. [DOI] [PMC free article] [PubMed] [Google Scholar]
- 24.Falcone V, Stopp T, Feichtinger M, et al. Pregnancy after bariatric surgery: a narrative literature review and discussion of impact on pregnancy management and outcome. BMC Pregnancy Childbirth 2018;18:507. [DOI] [PMC free article] [PubMed] [Google Scholar]
- 25.Henfridsson P, Laurenius A, Wallengren O, et al. Five-year changes in dietary intake and body composition in adolescents with severe obesity undergoing laparoscopic Roux-en-Y gastric bypass surgery. Surg Obes Relat Dis 2018. [DOI] [PubMed] [Google Scholar]
- 26.Samuel L, Borrell LN. The effect of body mass index on adequacy of serum 25-hydroxyvitamin D levels in US adults: the National Health and Nutrition Examination Survey 2001 to 2006. Ann Epidemiol 2014;24:781–4. [DOI] [PubMed] [Google Scholar]
- 27.Lee PC, Ganguly S, Dixon JB, et al. Nutritional Deficiencies in Severe Obesity: a Multiethnic Asian Cohort. Obes Surg 2019;29:166–171. [DOI] [PubMed] [Google Scholar]
Associated Data
This section collects any data citations, data availability statements, or supplementary materials included in this article.
Supplementary Materials
Supplemental Figure 1: Proportion of patients with 0, 1, 2 or 3 nutritional deficiencies after RYGB and VSG.
Supplemental Online Table 1: Prevalence of abnormal nutritional measures after RYGB or VSG.
Supplemental Online Table 2: Reported intake of supplements, medications, pregnancy and menstrual frequency [n/N (%)]