
Figure 4. Dietary vitamin D3 alters T cell levels in tongue tissues.
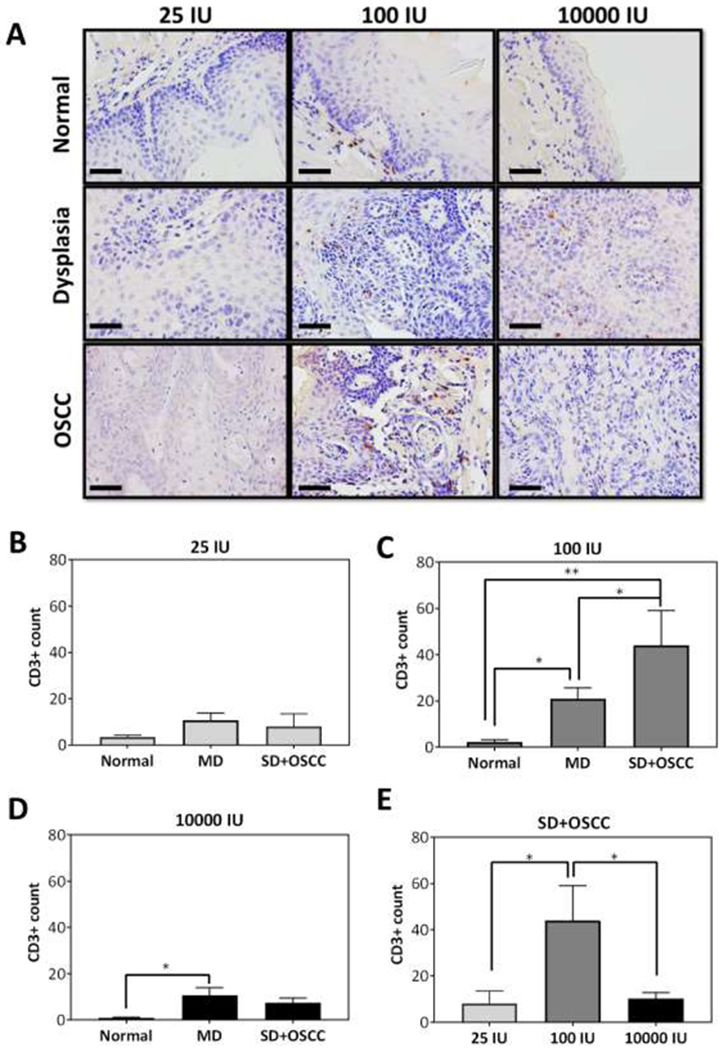
(A) Photomicrographs of CD3 stained sections (40X, scale bar - 50μm) of normal tongue epithelium, dysplasia and OSCC of a representative mouse from each diet group. (B-D) Counts of CD3+ T cells in normal, moderate dysplasia and severe dysplasia + OSCC tissues in mice across the three diets. (E) CD3+ T cell counts in SD+OSCC lesions in the three vitamin D3 diet cohorts. Mice on 100 IU showed significant increase in CD3+ T cell counts in SD+ OSCC compared to mice on 25 IU or 10000 IU. Reported values represent mean ± standard error. *p < 0.05, ** p <0.01