
Figure 3. The F-RAM and N-RAM Ensembles Show Distinct Activity Patterns During the Contextual Fear Memory Discrimination-Generalization Assay.
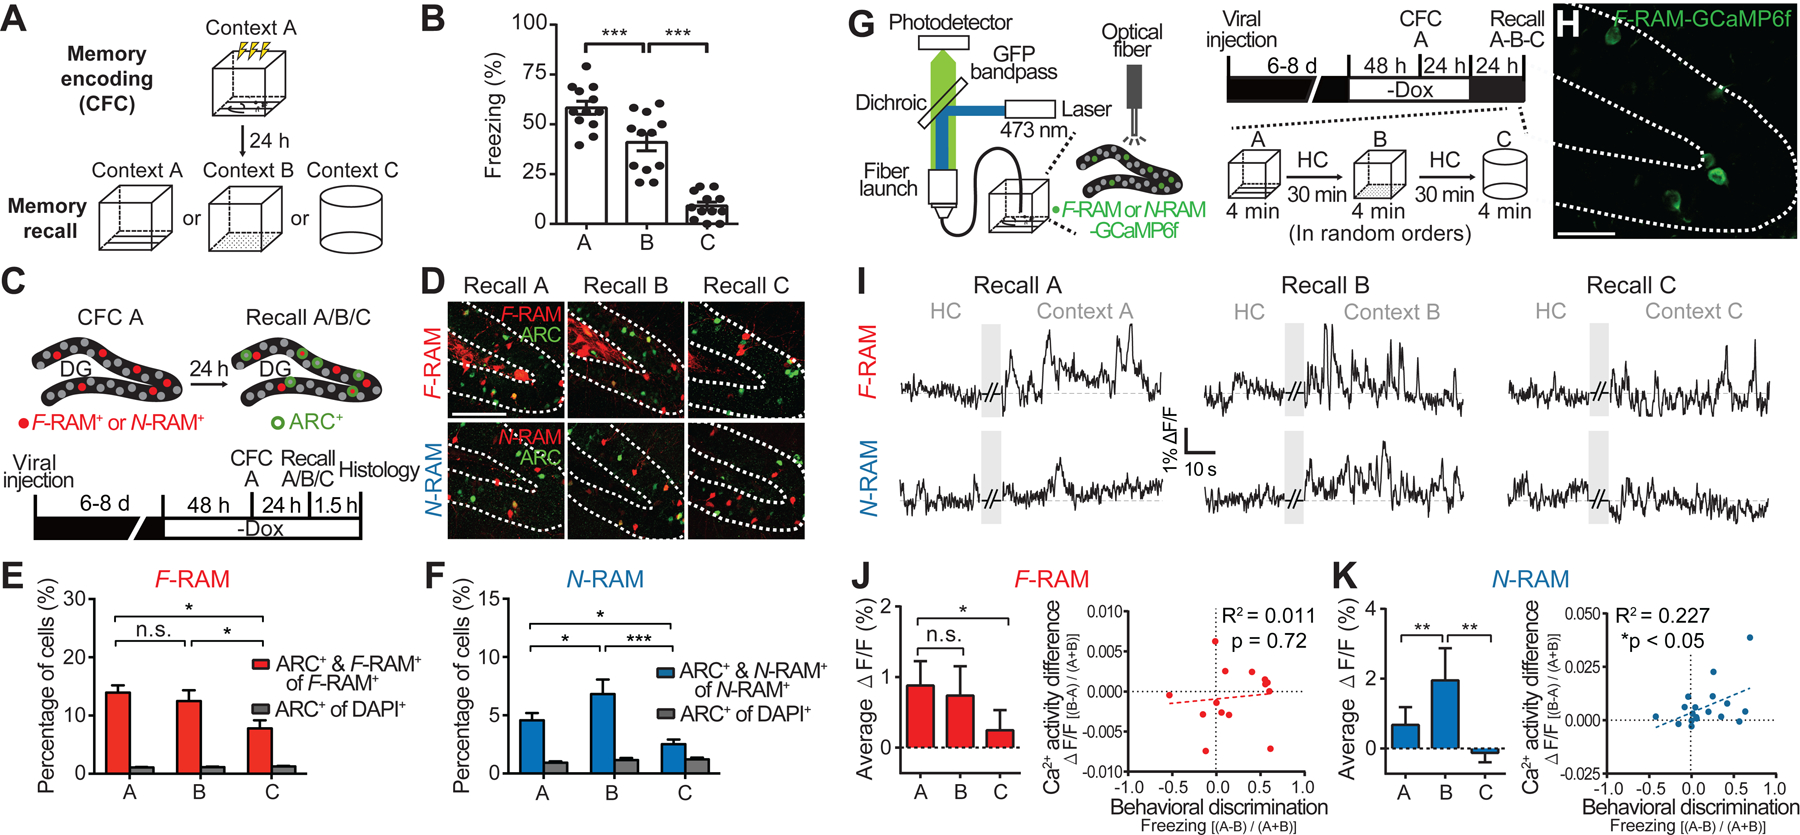
(A) Schematic of the behavioral assay.
(B) Freezing levels during memory recall in the three contexts. One-way ANOVA, Tukey’s test, n = 12 per group.
(C) Experimental scheme to identify recall-activated F-RAM and N-RAM ensemble neurons using Arc expression (ARC+).
(D) Representative images showing overlap (white arrows) of the labeled F-RAM+ or N-RAM+ neurons and ARC+ neurons.
(E and F) Percentages of the F-RAM+ (E) and N-RAM+ neurons (F) reactivated during memory recall. Two-way mixed ANOVA, Tukey’s test, n = 7–9.
(G) Schematic and timeline for examination of Ca2+ activity in ensemble neurons using fiber photometry.
(H) Representative image showing the expression of GCaMP6f in the F-RAM ensemble after CFC.
(I) Representative traces showing Ca2+ activity in F-RAM+ and N-RAM+ neurons.
(J) Left, F-RAM ensemble activity (ΔF/F) during memory recall in different contexts (Friedman’s one-way repeated measures ANOVA, Dunn’s test, n = 14). Right, correlation between animal’s ability to discriminate contexts A and B (Freezing[(A-B)/(A+B)]) and the difference in F-RAM ensemble activities in these two contexts (ΔF/F [(B-A)/(A+B)]; linear regression, n = 14).
(K) The same as (J), except for N-RAM (n = 19).