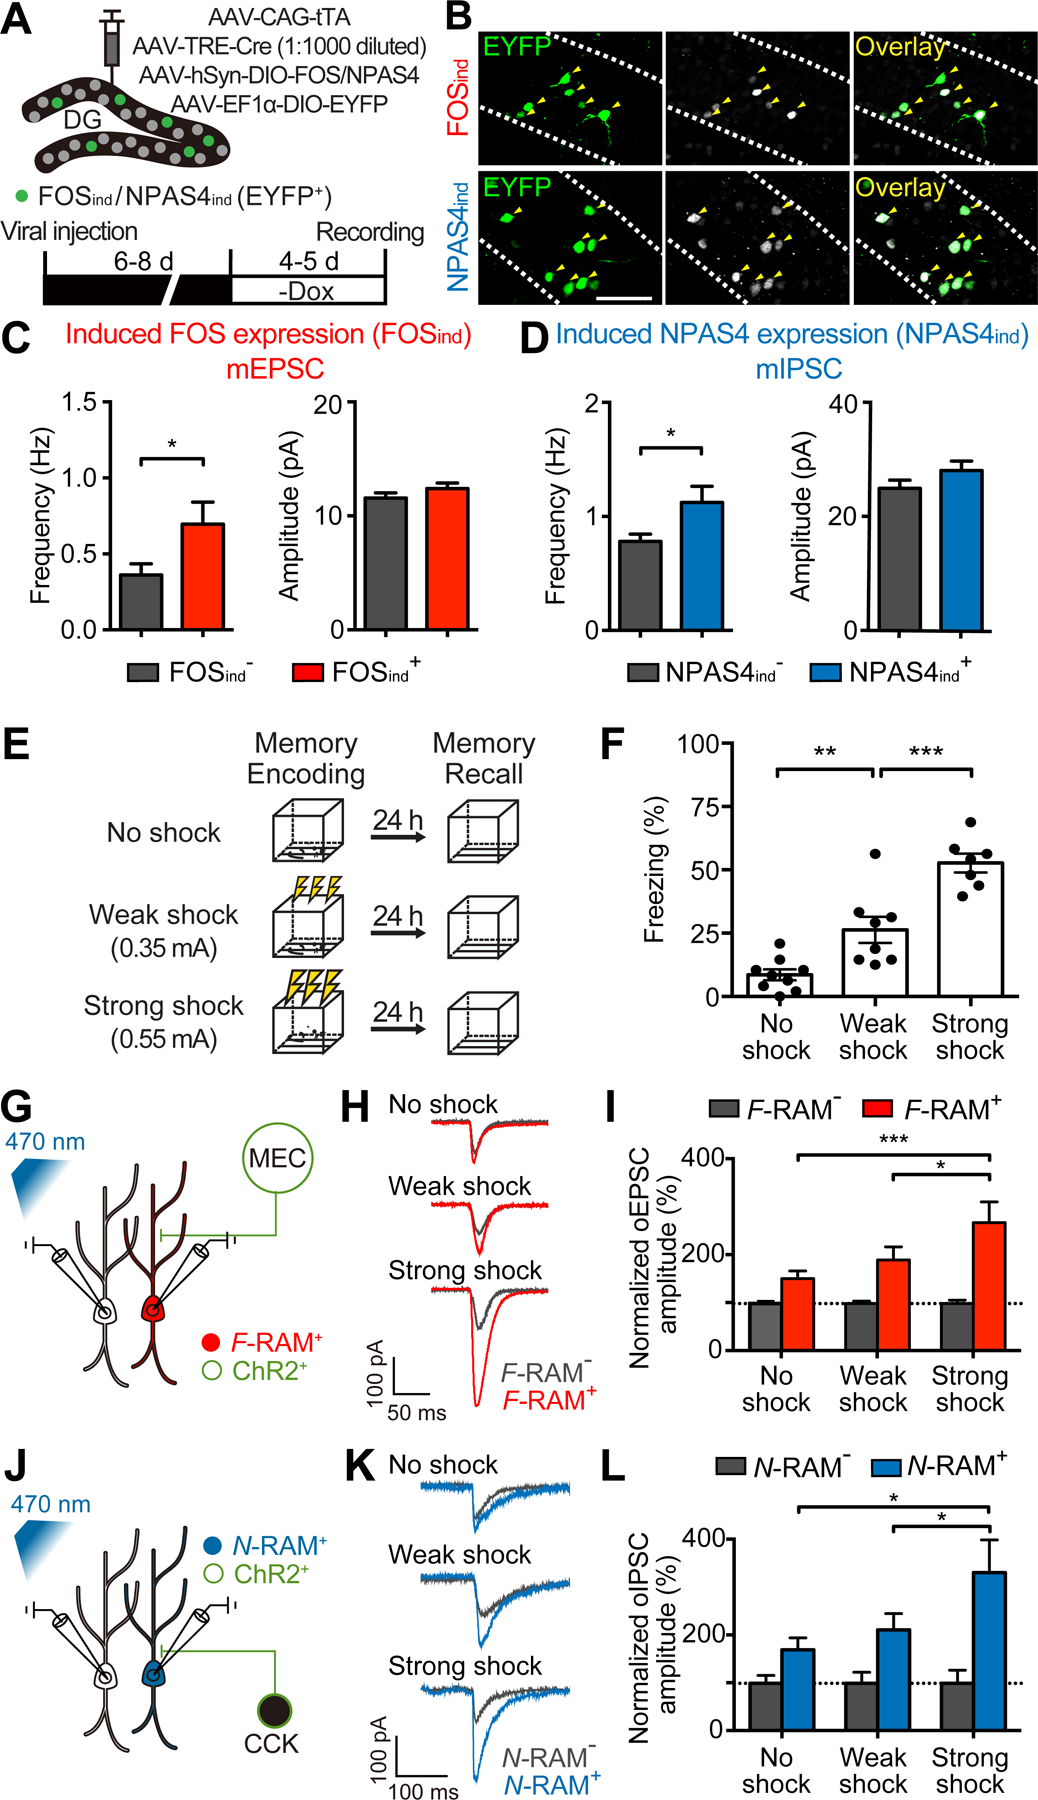
Figure 6. Synaptic Changes on Ensemble Neurons Are Correlated with the Strength of Learning.

(A) Experimental scheme for inducing FOS or NPAS4 expression in sparse and randomly selected DG neurons.
(B) Representative images showing induced FOS or NPAS4 expression (FOSind or NPAS4ind) in randomly selected neurons (EYFP+, white arrows).
(C) FOSind increased mEPSC frequency (Mann-Whitney test; EYFP−, n = 19; EYFP+, n = 20).
(D) NPAS4ind increased mIPSC frequency (n = 19, 20).
(E and F) Experimental scheme (E) showing that training of animals in context A with no shock, weak (0.35 mA) or strong shock (0.55 mA) resulted in different memory strengths, as indicated by levels of freezing (F; one-way ANOVA, Tukey’s test, n = 7–9).
(G and H) Experimental scheme (G) and representative traces (H) showing simultaneous recording of oEPSCs on F-RAM+ and F-RAM− cells with optogenetic stimulation of the MEC inputs.
(I) F-RAM+ cells showed the largest oEPSC amplitudes in the strong shock group (two-way mixed ANOVA, Tukey’s test, n = 24, 28, 21 pairs for no shock, weak shock and strong shock, respectively).
(J and K) Experimental scheme (J) and representative traces (K) showing simultaneous recording of oIPSCs on N-RAM+ and N-RAM− cells with optogenetic stimulation of the CCK+ interneurons.
(L) N-RAM+ cells showed the largest oIPSC amplitudes in the strong shock group (n = 19, 15, 9).
