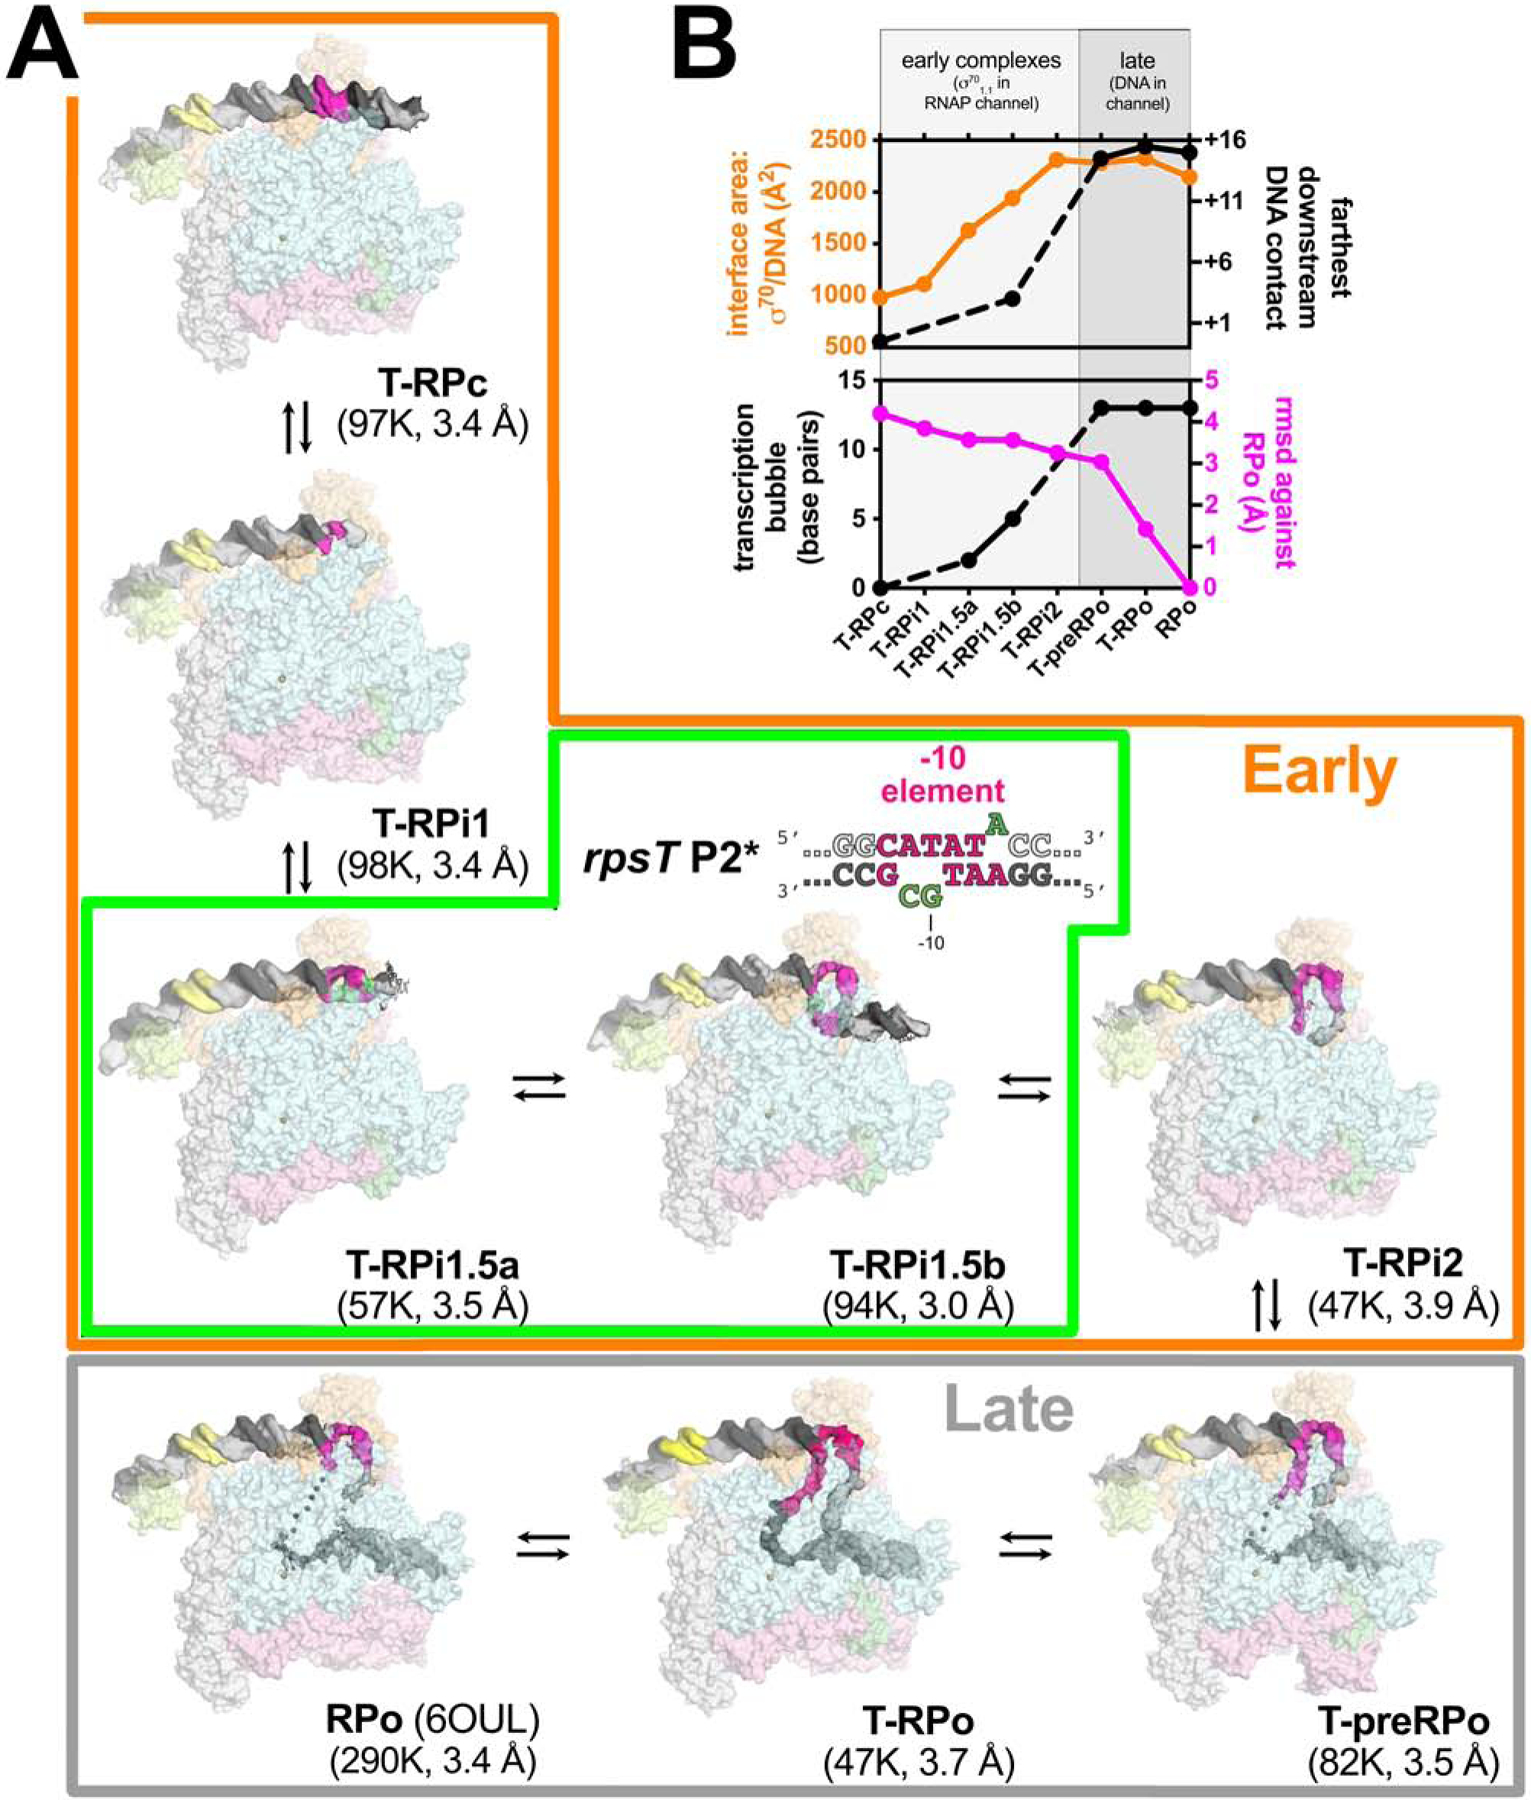
Figure 2. Eco Eσ70 promoter melting intermediates on the rpsT P2 promoter.

A. Overall structures of promoter melting intermediates obtained by cryo-EM. Proteins are shown as transparent surfaces (αI, αII, ω, light gray; αCTD, pale limon; β, pale cyan; β’, light pink; σ70, light orange; TraR, pale green). The Eσ70 active site Mg2+ is shown as a sand-colored sphere. The promoter DNA is shown as cryo-EM difference density (nt-strand, gray; t-strand, dark gray; −35 element, yellow; −10 element, hot pink). The eight structures were derived from three samples: Sample 1) T-RPc, T-RPi1, T-RPi2, T-preRPo, and T-RPo structures were obtained with TraR and the wt-rpsT P2 fragment (Figure 1A); Sample 2) T-RPi1.5a and T-RPi1.5b were obtained with TraR and rpsT P2* (boxed in green; nucleotide substitutions in rpsT P2* are colored green); Sample 3) RPo was determined previously with wt-rpsT P2 without TraR (Chen et al., 2019b). In the Early complexes (boxed in orange), σ701.1 occupies the Eσ70 channel. In the Late complexes (boxed in gray), downstream duplex DNA occupies the channel.
B. Structural properties used to order the complexes in the RPo formation pathway. (top panel) Plotted in orange (left scale) is the σ70/DNA interface area (Å2)(Krissinel and Henrick, 2007). Plotted in black (right scale) is the most downstream protein/duplex DNA contact. For T-RPi1, T-RPi1.5a, and T-RPi2, most or all of the downstream duplex DNA was disordered so no point is included.
(bottom panel) Plotted in black (left scale) is the extent of the transcription bubble. For T-RPi1 and T-RPi2, the downstream fork of the transcription bubble was disordered so no point is included. Plotted in magenta (right scale) is the root-mean-square deviation of α-carbons (Å) for each complex superimposed with RPo.
See also Figures S2 – S5 and Table S1.
