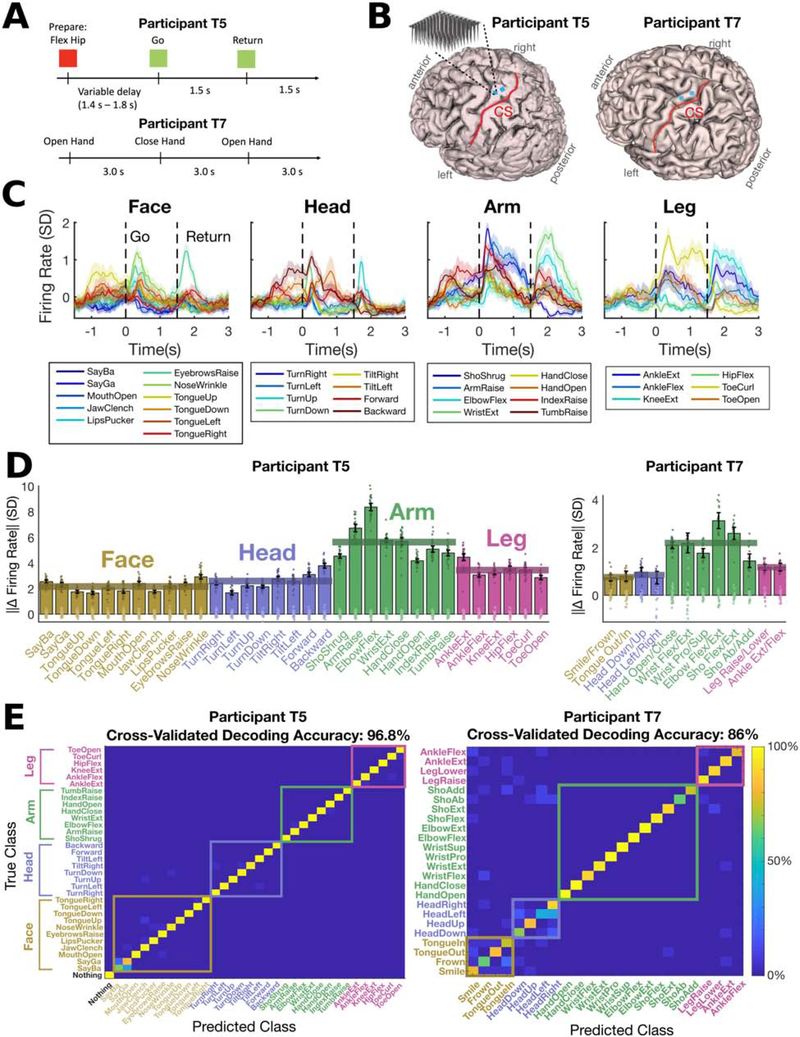
Figure 1. Separable and robust neural modulation for face, head, and contralateral arm & leg movements in hand knob area.
(A) Neural activity was recorded while participants T5 and T7 completed cued movement tasks that instructed them to make (or attempt to make) movements of the face, head arm and leg in sync with text appearing on a computer monitor.
(B) Participants’ MRI-derived brain anatomy and microelectrode array locations. Microelectrode array locations were determined by co-registration of postoperative CT images with preoperative MRI images.
(C) The mean firing rate recorded for each cued movement is shown for an example electrode from participant T5. Shaded regions indicate 95% CIs. Neural activity was denoised by convolving with a Gaussian smoothing kernel (30 ms sd).
(D) The size of the neural modulation for each movement was quantified by comparing to a baseline “do nothing” condition (in participant T5) or by comparing to its paired movement (T7). Each bar indicates the size (Euclidean norm) of the mean change in firing rate across the neural population (with a 95% CI). Each dot corresponds to the cross-validated projection of a single trial’s firing rate vector onto the “difference” axis. For T5, light dots represent the “do nothing” condition and dark dots represent the given movement. For T7, dark and light dots represent different movements of the given pair. Statistically significant modulation was observed for all movements (no confidence intervals contain 0). Translucent horizontal bars indicate the mean bar height for each movement type.
(E) A Gaussian naive Bayes classifier was used to classify each trial’s movement using the firing rate in a window from 200 to 600 ms (T5) or 200 to 1600 ms (T7) after the go cue. Confusion matrices are shown from offline cross-validated performance results; each entry (i, j) in the matrix is colored according to the percentage of trials where movement j was decoded (out of all trials where movement i was cued).

