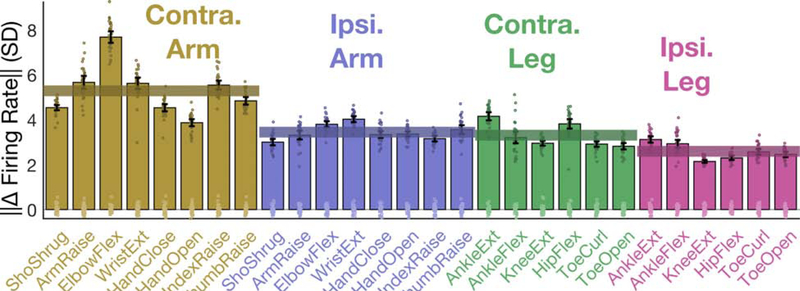
Figure 2. Modulation for ipsilateral vs. contralateral arm and leg movements.
The size of the neural modulation for each attempted movement was quantified by comparing to a baseline “do nothing” condition. Each bar indicates the size (Euclidean norm) of the mean change in neural population activity (with a 95% CI) and each dot corresponds to the cross-validated projection of a single trial’s neural activity onto the “difference” axis. Translucent horizontal bars indicate the mean bar height for each attempted movement type.

