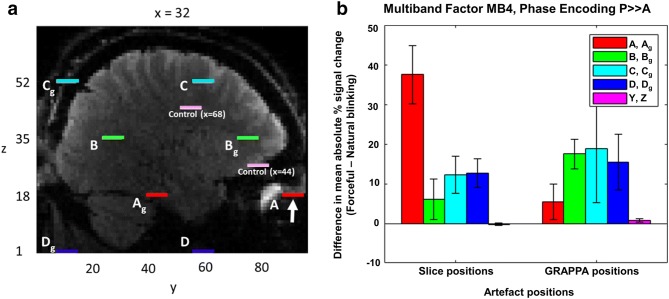
Fig. 2.
a Expected artefact locations in right hemisphere for an individual subject (centres of expected artefact disks are shown). A–D represent artefact positions expected based on SMS slice acceleration factor (MB4) and CAIPI shift (FOV/3); Ag–Dg represent artefact positions expected based on parallel imaging factor (GRAPPA-2; ((FOV/3)*m + FOV/2), where m goes from 1 to M (M being the number of simultaneously acquired slices). Coordinates for artefact source: x = 32, y = 91, z = 18; indicated by white arrow. Control regions are shown in light pink: y and z coordinates are as shown in the figure; x coordinates are specified for each control mask. b Difference (± standard error of the mean; SEM, n = 4 subjects) in signal fluctuation between forceful blinking (on) and natural blinking (off) blocks; data are shown for expected artefact and control regions (right hemisphere). Control regions X and Y correspond to mean ± standard deviation [x y z] coordinates (in subject space) of [43 ± 1.9 65 ± 9.6 27 ± 4.0] and [67 ± 1.9 41 ± 9.6 44 ± 4.0], respectively

