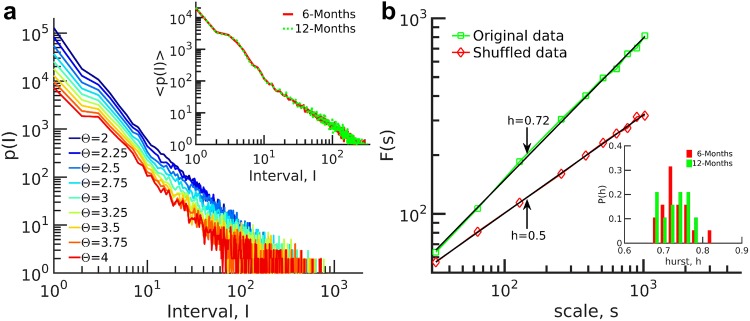
Fig. 8.
Distribution of peak intervals for subject #14 at 12 months at SD. a The distributions display a straight line on a bi-logarithmic scale which is similar for different thresholds. Inset: Average distribution over subjects for all the 6-month-old and 12-month-old infants. The distributions exhibit a scale-invariant behavior in intervals. b Fluctuations over scales and the Hurst exponent of peak intervals. The Hurst exponent of original data is and demonstrates LRTC which is destroyed by shuffling the data. The distribution of h for all subjects at two ages is shown in the inset of b. No significant difference was detected between the two ages

