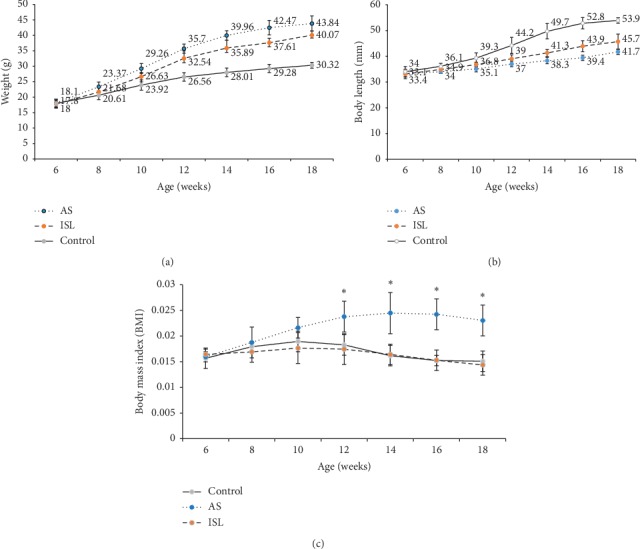
Figure 1.

Body weight and length and body mass index of mice in three groups (n = 20). (a) Body weight in different groups of mice of different ages. (b) Body length in different groups of mice of different ages. (c) Body mass index (BMI) in different groups of mice of different ages. Control: control group; AS: atherosclerosis group; ISL: isoliquiritigenin group. ∗P < 0.05 compared to AS at the age of 12, 14, 16, and 18 weeks.
