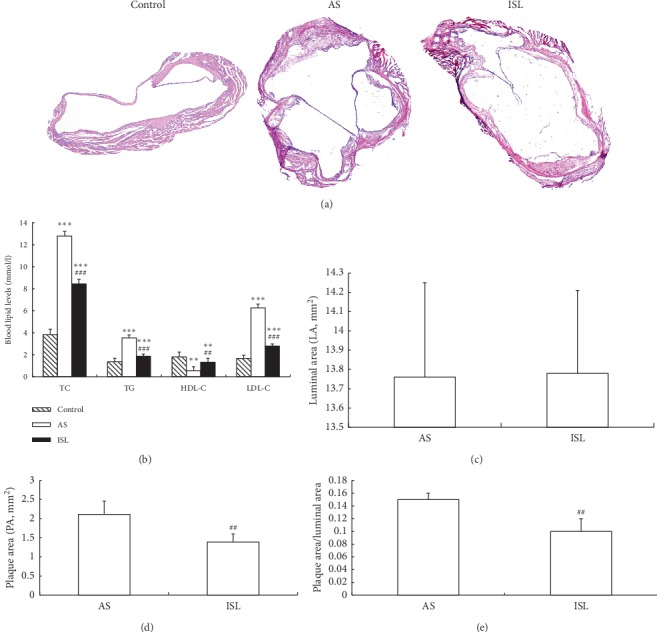
Figure 2.

Histology and morphometric analyses of atherosclerotic lesion (n = 20). (a) HE staining of aortic tissues (×40). No obvious aortic lesion was observed in control group. AS group showed unstable plaques which were diffusing all the lumen of aortas, but they were improved in ISL group. (b) The levels of blood lipids (unit as mM) in different groups. (c) Comparison of luminal area (LA, unit as mm2) in AS and ISL groups. (d) Comparison of plaque area (PA, unit as mm2) in AS and ISL groups. (e). Comparison of the ratio of PA/LA in AS and ISL groups. ∗∗P < 0.01, ∗∗∗P < 0.001, compared to control group; ##P < 0.01, compared to AS group. Control: control group; AS: atherosclerosis group; ISL: isoliquiritigenin group.
