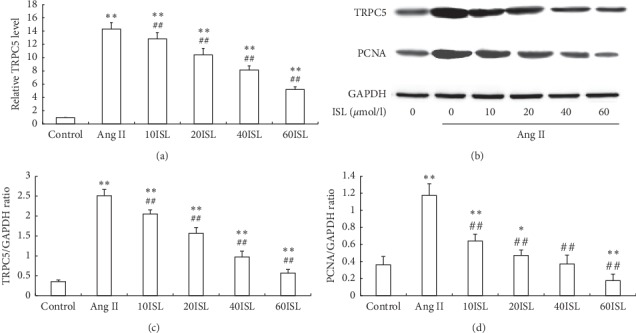
Figure 5.

ISL inhibited TRPC5 and PCNA expressions in VSMCs. (a) The mRNA levels of TRPC5 in different groups. (b) The protein levels of TRPC5 and PCNA were determined by Western blot analysis. GAPDH was loading control. The representative images were shown from 5 independently performed tests. (c) Densitometry analysis of TRPC5 protein expression. (d) Densitometry analysis of PCNA protein expression. Values are expressed as means ± SD (n = 5). ∗∗P < 0.01, compared to control group; ##P < 0.01, compared to Ang II group. Control: control group; Ang II: Ang II group; 10ISL: Ang II 10−6 mol/l + 10 μmol/l ISL group; 20ISL: Ang II 10−6 mol/l + 20 μmol/l ISL group; 40ISL: Ang II 10−6 mol/l + 40 μmol/l ISL group; 60ISL: Ang II 10−6 mol/l + 60 μmol/l ISL group.
