
Figure 5.
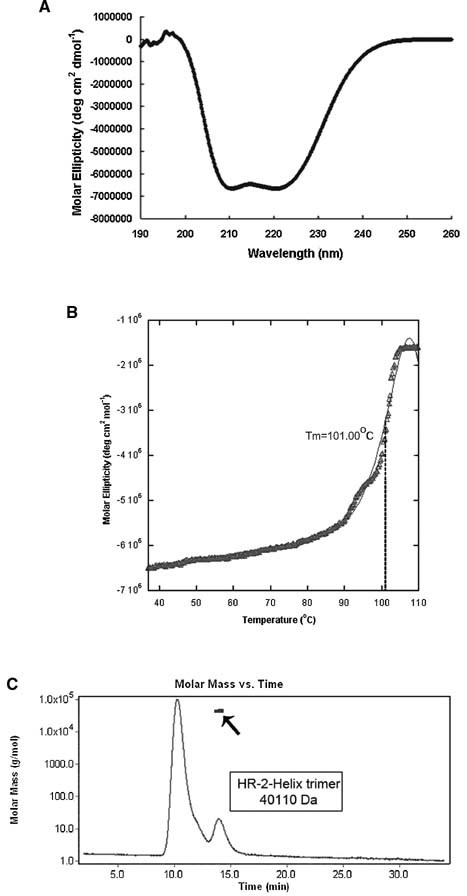
Characterization of HR‐2‐Helix. CD spectrum (A) and thermal denaturation curve (B) are shown. The Tm was 101.00°C. Laser light scattering analysis showed that HR‐2‐Helix forms a monodispersed species of 40,110 Da. The solid horizontal bar indicates the average molecular weight for the HR‐2‐Helix peak (C).