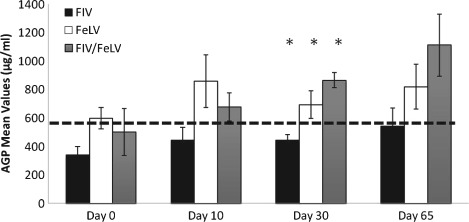
Figure 2.

Mean ±standard error (se) serum concentrations of α‐glycoprotein‐1 (AGP) in naturally retroviral infected cats, before (D0) during (D10 and D30) and after (D65) rFeIFNω therapy. The horizontal line represents the upper limit of the reference interval (260 to 580 µg/mL). The observed increase was statistically significant (Friedman test D0 versus D65 P=0·012). Groups are statistically similar except at D30 (*). Kruskall–Wallis P=0·016; Pairwise comparison: FIV versus co‐infected: P=0·029; FIV versus FeLV: P=0·067; FeLV versus co‐infected: P=0·12
